Portfolio Review – Q3 2023 – Issue 20
This is the latest One Four Nine Portfolio Management (OFNPM) portfolio review providing investors and advisers with an easy to digest overview of what’s happening in the markets globally, alongside comparisons of OFNPM’s portfolio performance each quarter and throughout the year.
Chief Investment Officer’s comments
The rate rises we have seen in the past 20 months or so have been relentless. At consecutive meetings, central banks raised rates again and again to combats levels of inflation not seen since the 1980s. Alongside these rate rises central banks globally have embarked on quantitative tightening at the same time to give us an unprecedented level of monetary tightening. Through all of this inflation remained stubbornly high refusing to drop at the pace that central banks wanted and perhaps needed.
However, in the last three months we may have witnessed central bank actions finally having the desired effect. The last rate rise we saw from the Federal Reserve was in July when the upper bound of the Fed Funds Rate was raised 25 basis points to 5.5%. It has remained there since then through two meeting cycles. It is a similar story in the UK where the Bank of England have held rates at 5.25% through two meeting cycles with the last 25 basis point rise coming in August. The ECB has been playing catch up, raising rates from 4.25% to 4.50% in September, but held them at that level in the October meeting.
Rates have been held because we have started to observe meaningful drops in inflation. At the beginning of the year the inflation rate in the UK was 10.5%. By the end of September this had dropped to 6.7%, slower than hoped but still a substantial decrease. In the US the inflation rate almost halved from 6.5% to 3.7%. Expectations of both the market and central banks is for inflation to fall further by year end.
Stubbornly high inflation
These rates though are still well in excess of the 2% inflation target of central banks. Moreover, core inflation (which excludes food and energy) remains stubbornly high and above headline inflation. In the UK core inflation was 6.1% at the end of September barely lower than the 6.3% reading at the beginning of the year. In the US there has been more success in reducing core inflation but it too is above headline inflation having dropped from 5.7% to 4.1% over the year.
It would seem that we have reached the peak of this rate cycle, with central banks holding rates at current levels and inflation moving in the right direction. Central banks however were quick to caveat the rate holds, warning the market that they expected rates to stay at these levels for much longer than anticipated and that inflation is still, not tamed. Moreover, while rates may have peaked there is still further quantitative tightening occurring with reductions in central bank balance sheets which will keep monetary conditions tighter for longer. The Federal Reserve balance sheet has fallen from $8.6 trillion to $7.8 trillion over 2023. Apart from a sharp rise in March to bail out some smaller US banks that saw significant runs on reserves, it has been falling at a steady rate since April 2022, when it peaked at $9 trillion.
When will rate cuts happen?
Rate expectations have now plateaued with only small probabilities attached to a rate rise in the near term and with the first cut now not expected by the market until the third quarter of next year in the UK. In the US the market is expecting a rate cut towards the end of the second quarter of 2024, but these rate cuts are far from a done deal with the market and central banks watching inflation data keenly. If we have reached peak rates, and certainly the evidence suggest we have, then the outlook for bonds becomes more benign. The risk of more rate rises has diminished and consequently so has the risk of loss to holding longer duration bonds. The risk reward payoff of bonds has significantly improved, which provides some much-needed respite for investors who have held long duration bonds throughout this rate rising cycle and are now sitting on stinging losses. For those, like us, who have kept duration short and not participated in the carnage of the bond market there is an opportunity now to extend duration and get ahead of the curve for when rate cuts do happen.
There has always been a risk that these rate rises would have an impact on economic growth and potentially push economies into recession. Thus far this has not been the case but growth has been anemic at best around the globe. In the US the economy has grown 2.3% this year with all quarters recording positive growth numbers. This is far from recessionary conditions. In the UK and Europe, it has been a different story with growth of just 0.5% and 0.1% respectively year to date. In the third quarter this year UK growth was flat while Eurozone growth was negative at -0.1%. The UK and the Eurozone are much closer to a recession. The market may look to rate cuts to help generate economic growth but both the BOE and the ECB have stated that this will not be the case until inflation is firmly under control, lest they reignite inflationary conditions.
It would seem for now that central banks have achieved the impossible, controlling inflation by cutting rates yet avoiding a recession. It is not yet time to rejoice as our central view is that while we will avoid a harsh recession, growth will remain low for some time to come. We believe that inflation will be back towards target by the end of the first quarter of 2024, and then rate cuts may be needed to stimulate the low growth economy, which will be positive for bonds and equities alike.
Market Performance
Markets digested the warnings from central banks that rates would stay higher for longer to combat inflation in different ways. There was a twisting of the yield curve in the UK, with short maturity rates falling while long maturity rates rose. Therefore, the inversion we have witnessed in the yield curve has diminished, although short rates are still higher than long rates and the curve remains inverted.
In the UK the ten-year Gilt yield rose from 4.36% at the end of July to 4.51% by the end of October. The longer the maturity the larger the yield rise was with the thirty-year Gilt moving from 4.46% to 4.97% over the same period. At the short end it was a different story with the two-year Gilt yield falling from 5.00% to 4.78%, and the three-month UK T-Bill falling slightly from 5.47% to 5.37%, nearly 2% of tightening.
Gilts overall lost 2.0%, over the period from July to October, but there was significant divergence of returns between maturity bands. Short dated 1–5-year Gilts gained 1.8% over the period but Gilts dated longer than ten years lost 5.8% on average. Index linked Gilts, which are mainly long-dated, fared even worse losing 6.2%. Keeping duration short helped to protect portfolios and in some cases added to performance.
Sterling investment grade credit out-performed Gilts significantly over the three months to October losing just 0.3%. This outperformance was driven more by duration than it was credit tightening. Short-dated sterling corporate bonds gained 1.9%, slightly more than short-dated Gilts which were up 1.8%. There was little movement in credit spreads, with UK spreads close to their long-term median. In the US spreads continued to tighten and are now in the lowest quartile of their history, which may be a cause for concern should a recession develop in the US as it is likely they will widen, although this may be offset by falling yields.
Equities on the whole took a battering during the three months to October, although not enough to erase gains from earlier in the year. There was nowhere to hide with all equity regions and all sectors, bar energy, recording negative returns. This was a direct consequence of the “higher for longer” message from central banks and as the cost of long yields rose so the market re-evaluated the weighted average cost of capital for equities upwards, which in turn discounted cash flows at lower values and so led to falls in markets.
Returns were driven by contracting valuations rather than lower earnings, although this was regionally dependent. The UK, Europe and Japan all experienced strong earnings growth over the three months to October, while earnings in the US were essentially flat. Asia Pacific and Emerging markets though saw a fall in earnings as the under performance of the Chinese economy continued to hamper returns and company results in the region.
Globally equities lost 3.8% during the three months to October as measured by the MSCI World. The US was the best performing region falling just over 3%, while Japan was not far behind losing 3.3%. The UK and Europe lagged behind losing 4.3% and 6.6% respectively. Asian and Emerging stocks were particularly hurt falling 7.1% and 6.9%.
Growth stocks led the global sell-off falling 4.4% while value stocks fell 3.2%. The big difference was between large cap stocks which fell 3.2% and small caps stocks which fell 9.3%. This is a clear sign that the market is worried about a recession and its effect on weaker companies and those less able to withstand potential economic storms. This was especially acute in the UK where mid-cap stocks fell 10.0% and small cap stocks 8.1%. Large cap stocks fell just 3.2% implying those stocks with more exposure to the UK economy suffered the worst.
The only sector to produce a positive return was the energy sector which gained 5.9% over the three months to October, as oil prices rose slightly and other commodities in general fell. All other sectors suffered losses with the next best performing sector, healthcare, losing 2.4%. The worst performing sector was consumer discretionary which fell 7.2%, a possible sign that markets are worried about the consumer retrenching their spending habits as a recession bites. Industrials and materials were the next worse performing sectors falling 6.5% and 6.0% respectively, again a sign of the markets worry around demand.
Finally, sterling weakened against the Dollar by 5.3% as the Dollar strengthened against most major currencies. The Dollar index gained 4.7% the three months to October. Sterling was a little weaker against the Euro falling 1.6%, while it strengthened slightly against the Yen, gaining 1.1%.
Portfolio performance
Your portfolios generated a mix of positive and negative returns over the quarter, with higher risk portfolios underperforming lower risk portfolios. The table below shows returns for Active, Passive and Sustainable portfolios, alongside the returns of their respective inflation benchmarks and for comparison purposes their appropriate IA sector over the quarter.
| 3 Months to 30 October 2023 | Active | Passive | Sustainable | Inflation Benchmark | IA Sector |
| Defensive | -0.08% | 0.65% | 0.10% | 0.38% | |
| Cautious | -1.31% | -0.42% | -1.05% | 0.63% | -2.46% |
| Balanced | -2.76% | -1.76% | -2.51% | 0.88% | -3.29% |
| Growth | -4.00% | -2.88% | -3.69% | 1.12% | -4.40% |
| Adventurous | -5.24% | -4.00% | -4.94% | 1.36% |
Source: Morningstar
Portfolios with higher weights to equity suffered losses as we moved up the risk spectrum, while those portfolios with higher fixed income weights benefited our low duration positioning, protecting and growing capital and in some cases providing positive returns. Our non-equity assets gained 0.60% over the quarter while our active equity funds lost 5.7% underperforming our passive equity funds which fell 4.6%. Overall, our portfolios outperformed their relative IA sectors, whether they be Active, Passive or Sustainable.
The chart below shows the returns of funds within the portfolios for the quarter.
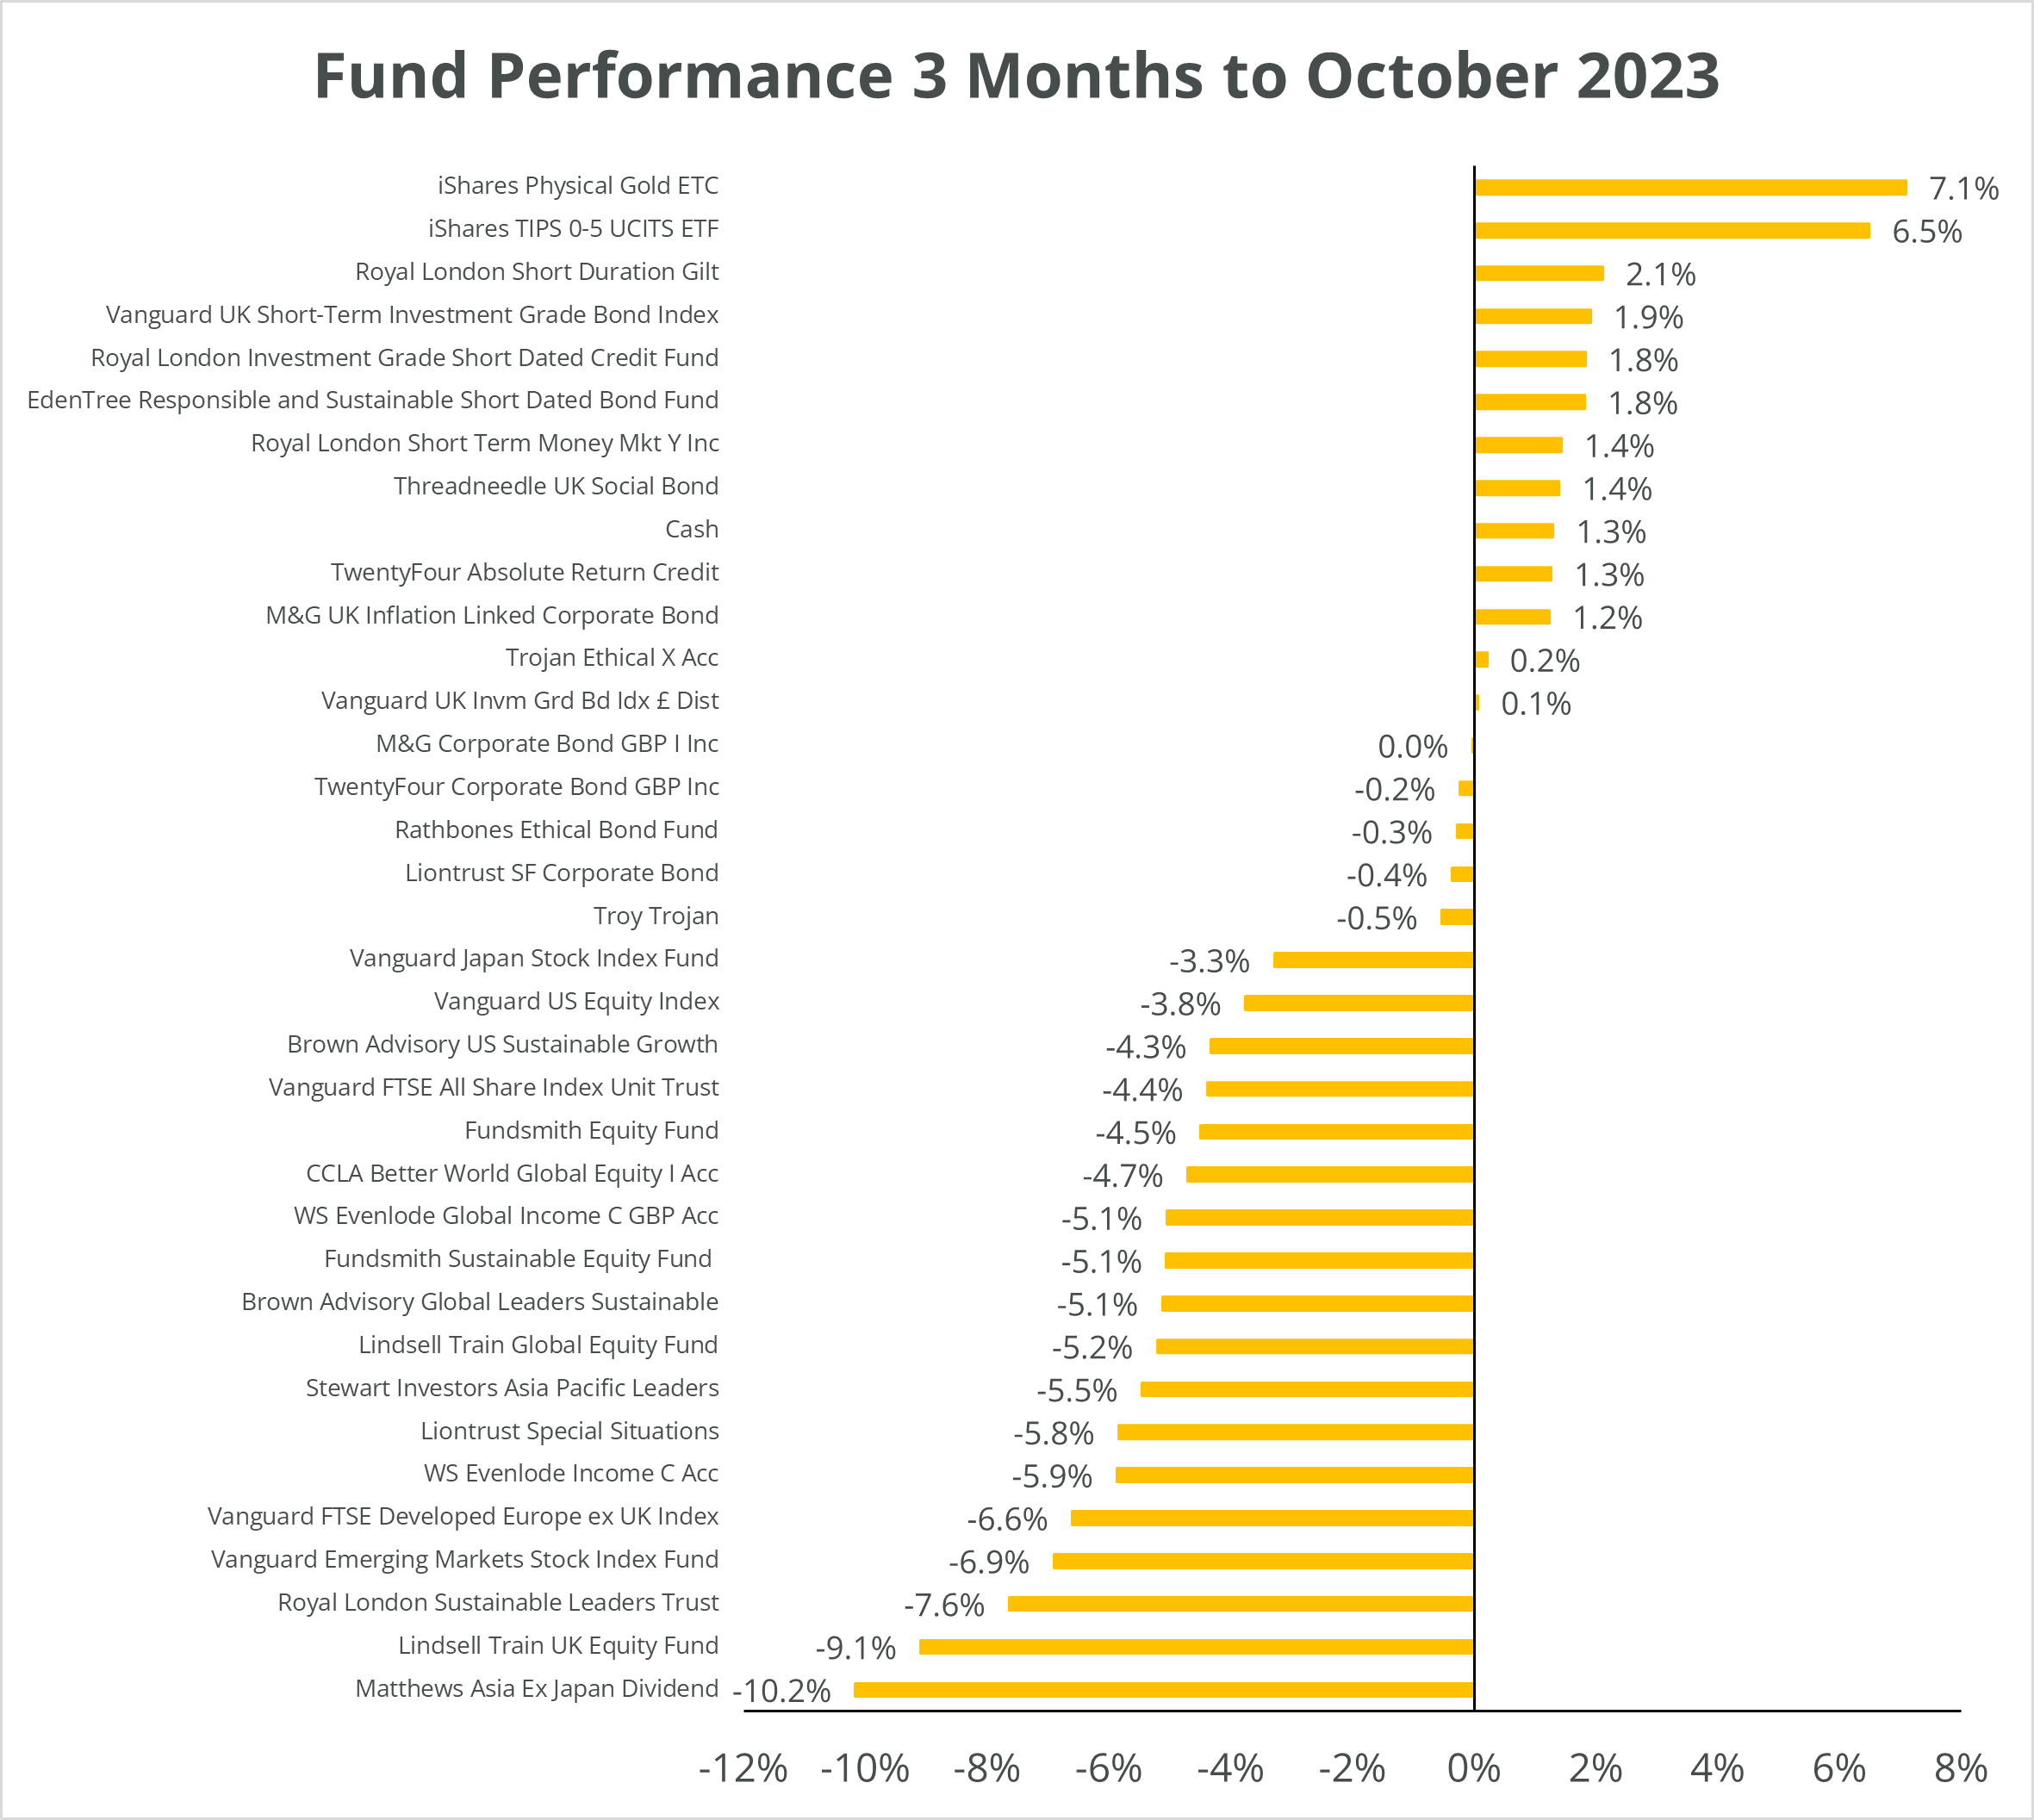
Source: Morningstar
All of our short duration bond funds, both active and passive, posted positive returns over the quarter, with our sustainable bond funds performing slightly better than our general bond funds. Our longer duration bond funds did fall, but only in line with credit markets with returns between 0.1% and -0.4%. Our bond funds when viewed as a portfolio gained 0.8% over the three months to October.
All our equity funds, both active and passive, fell over the three months to October. Most of our active funds underperformed their reference benchmarks as they have little or no exposure to the energy sector, which was the only positive performing sector over the period. Those funds that had a bias towards small and mid cap stocks also underperformed. Our global funds continued to be the best performing active equity funds with their bias towards the US. Our Asian and UK stocks were some of the worse performers, especially those with a small cap bias, in particular Matthews Asia ex Japan which has a significant allocation to small cap China and Lindsell Train UK which suffered from more idiosyncratic issues with some holdings.
We remain committed to our equity growth bias within portfolios, not least because the majority of our funds have continued to report that their underlying holdings have on average grown their earnings over the year. We invest for the long-term growth in earnings rather than try to trade the valuation cycle.
Portfolio outlook
We made no changes to the portfolios over the three months to the end of October 2023. We believe the portfolios are well positioned to weather any potential market dislocation.
Find out how One Four Nine Portfolio Management invest here.
Dr Bevan Blair,
Chief Investment Officer,
One Four Nine Portfolio Management
London, Thursday 14 December 2023.
All investment views are presented for information only and are not a personal recommendation to buy or sell. Past performance is not a reliable indicator of future returns, investing involves risk and the value of investments, and the income from them, may fall as well as rise and are not guaranteed. Investors may not get back the original amount invested.
All data is at 31 October 2023. One Four Nine Models are benchmarked against UK CPI and any other benchmark has been displayed for comparative purposes only and is not a benchmark for the Models. Performance figures are net of underlying fund fees and include One Four Nine Portfolio Management’s Management Fee of 0.24% (including VAT). All model portfolio performance data is sourced from One Four Nine Portfolio Management. All other data is from Bloomberg and Morningstar.
This service is intended for use by investment professionals only. This document does not constitute personal advice. If you are in doubt as to the suitability of an investment, please contact your adviser.
One Four Nine Group Limited Registered in England No: 11866793. One Four Nine Portfolio Management Limited is registered in England No: 11871594 and is authorised and regulated by the Financial Conduct Authority (FCA) FRN: 931954. One Four Nine® is a registered trademark.