Portfolio Review – Q1 2024 – Issue 22
This is the latest One Four Nine Portfolio Management (OFNPM) portfolio review providing investors and advisers with an easy to digest overview of what’s happening in the markets globally, alongside comparisons of OFNPM’s portfolio performance each quarter and throughout the year.
Chief Investment Officer’s comments
Inflation and central banks’ response to inflation via monetary policy is still the single largest determinant of short-term returns in markets. It has been the key overriding theme since late 2021 and it shows no sign of abating as a determinant of short-term noise in markets.
Central banks globally maintained rates at their current levels over the quarter. There was one outlier to this as the Swiss National Bank (SNB) cut rates, but by and large policymakers left rates at their current levels. During the fourth quarter of 2023 the market became very excited at the prospect of rate cuts in early 2024 as it appeared that inflation was falling towards central banks’ target rates, and the central banks themselves made noises about halting rate rises and even offered glimpses of hope that some of these may be reversed. On the back of this, we saw significant falls in bond yields and strong positive returns from bond markets.
It was however not to be. As the first quarter of 2024 evolved data showed that the inflation rate, while falling, was not falling as fast as first hoped, and in the US it even started to increase slightly again. Inflation was showing strong signs of “stickiness”. The chart below shows the rate of inflation for the US, UK and Eurozone from the beginning of 2023 to end of the March 2024. In the UK and EU it shows that inflation has fallen significantly from its high levels in early 2023 and is possibly approaching the target rate of 2%. In the US though we see that the rate falls to 3.0% in June of 2023, but then plateaus and starts to rise slightly to 3.5% in March 2024.

Source: Morningstar
This is worrying for central banks as they probably hoped that with their tight monetary policy inflation would be firmly back at or near target by now. The market too thought that this would be the case and hoped that there would be room for rate cuts in the near future.
Expectations vs reality
In December of 2023, the market was expecting that in the US the first interest rate cut would come in March 2024, that there would be between 6 and 7 rate cuts by the end of the year, and that the Federal Reserve rate would be between 3.75% and 4.00% by December 2024. Because of the stickiness of inflation, the market has had to reassess this outlook quite starkly. Now the market expects the first rate cut in the US to come not in March (spoiler alert there wasn’t one!) but either August or September, that there will be between 1 and 2 rate cuts this year and that the policy rate at year-end will be between 4.75% and 5.00%. This has been a significant shift of rate expectations in just three months.
The story is almost exactly the same in the UK and EU. In the UK now, the first cut is expected in August as opposed to May, there will be between 2 or 3 rate cuts rather than 6 or 7 and the Bank of England (BOE) base rate will end between 4.50% and 4.75%, rather than 3.50% to 3.75%. It now looks likely that the European Central Bank (ECB) will be the first of the major central banks to move rates down as inflation there is now just 2.4%, with little economic growth to speak of to reignite it. In other words, they have room to cut.
Inflation has remained sticky because economies have been performing much better than expected when the current rate hiking cycle commenced. Many had anticipated a recession in the face of strong interest rate rises, and while in Europe and the UK this has been the case in the US not only has a recession been avoided thus far, but the economy has been growing strongly. Even in the UK and the EU, the recession has been mild, to say the least, and there are signs that they have exited it already.
Strong job markets
One of the key reasons why we have not thus far entered a more prolonged economic downturn in the face of higher interest rates has been that labour markets have remained very strong. In the US job creation as measured by non-farm payrolls has exceeded expectations and been consistently positive. The US is adding jobs, even as monetary policy tightens.
In the UK, the unemployment rate has changed little in the two years since the hiking cycle began. Wages have on the whole not kept pace with inflation over the last three years but there has been some wage growth. While there is a cost of living crisis the fact that people on the whole remain employed has meant that even if their real take-home pay is lower, their nominal pay is higher and they remain employed. As such the cuts a household may need to make in the face of higher interest costs have not been as high as might have been. Interest rates at their current levels have not been sufficient to derail the economy because of this.
In our last quarterly review, we stated that a strongly growing economy, coupled with inflation still above target would mean no rate cuts in the first quarter of 2024, as we felt that any cut would potentially reignite inflation before it had been brought back under control. and towards target. We have been proven right.
No rate cuts yet
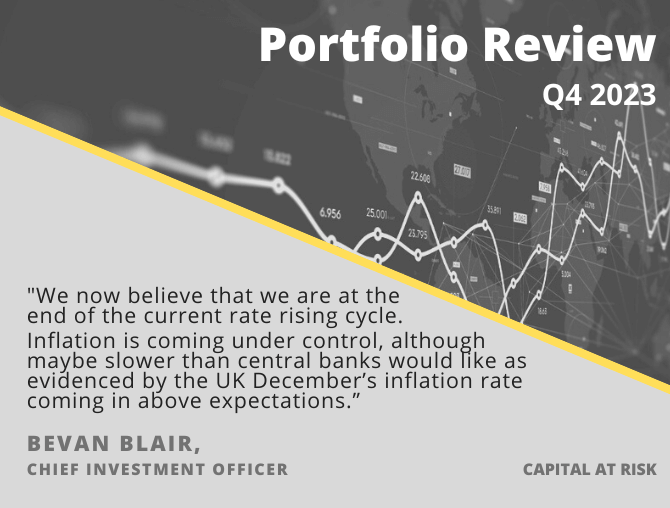
We are now at the end of the current rate rising cycle and have been for some time. Inflation is coming under control, although maybe slower than central banks would like. Last quarter we thought that we would not see any rate cuts until the second half of 2024 and we still believe this. We did not feel that rate cuts were just around the corner, and nor do we now. Rather central banks globally will wait until there is real confirmation that inflation has eased back to target, and that this is sustainable for the foreseeable future, before they initiate any monetary easing. The conditions for this may start to exist from July or August onwards but not now, especially if economies start to grow globally. The outlier may well be the ECB as there is evidence that their rate programme has hurt their economies more than the UK and the US, and they may need to cut earlier to spark the economies back into life.
When rate cuts do happen we do not expect rates to head back towards the “emergency” levels of 2008 to 2021. Central Banks will want to keep some rate powder dry for the next existential crisis they may face. We think this rate-easing cycle will be shallower than previous cycles. This would be further reinforced if economies are growing as there will be no need to cut so drastically if economies are growing (or even stagnating with high leverage levels and high rates).
Markets, both bond and equity, are very focused on the number and timing of rate cuts and we feel they will be in a period of range trading until they get clarity from central banks about when these cuts may happen. Until then markets will be noisy and directionless. Maybe once we get the first rate cut markets can end their obsession with rates and inflation and focus on growth as a driver of market returns, with fixed income retreating to a more predictable dull market, as it should be!
Market performance
Equity and bond markets moved in opposite directions over the quarter. Bond markets globally fell as yields expanded on revisions to interest rate expectations, while equity markets posted strong positive returns as momentum showed no sign of abating.
In the UK, the Gilt yields rose across all maturities, more so at the longer-dated end of the curve. The two-year Gilt yield rose from 3.98% to 4.17%, an increase of 19 basis points while the ten-year Gilt yield rose from 3.53% to 3.93%, an increase of 40 basis points. The yield curve remains inverted, but the strength of this inversion has diminished as the yield curve flattened. Gilts therefore lost money over the quarter with longer-dated Gilts underperforming shorter-dated ones. The 1-5 year Gilt index lost 0.23% over the quarter while the 10-year plus index lost 3.13%. On average Gilts as a whole lost 1.85% over the quarter.
It was a similar story in the US as yields rose across all maturities. The US ten-year treasury yield rose 33 basis points to 4.20% at the end of the quarter. US treasuries lost 0.94% over the quarter, less than the UK reflecting the lower duration of the treasury market in the US.
These upward movements in the yields are a direct consequence of the market’s reevaluation of the future path of interest rates. As markets have pushed out their expectations for the timing of rate cuts, and the number of them has fallen, yields have moved back upwards. We also note that breakeven yields have increased as the market expects higher inflation in the near future, or at least inflation not to come down as quickly as first thought.
Sterling investment grade credit however produced positive performance over the quarter as spreads continued to narrow, testing their all-time lows. Short-dated (1-5 year) sterling credit gained 0.87% over the quarter in contrast to the loss experienced in Gilts. The broad investment grade sterling credit index gained 0.16%, a significantly better return than gilts.
Equities meanwhile continued their strong performance from Q4 2023 into Q1 2024 with the MSCI world gaining 9.88% over the quarter in sterling terms. There was some style differentiation with growth stocks gaining 11.24% and value stocks gaining 8.47%. Quality stocks performed even better gaining 12.59%.
There was significant regional variation, tempered by currency movements. Japanese and US equities were by far the strongest performing regions during the quarter delivering double-digit returns in both local currency and sterling terms. Returns from the UK, Asian and Emerging markets were significantly behind those of Europe, Japan and the US, as they were last year.
The table below shows the returns of six equity regions, in local currency terms, broken down by return due to income, change in valuation and growth in earnings over the quarter.
| Returns Q1 2024 | Total Return | DY | PE Change | EPS Growth | DY Growth |
| UK | 4.05% | 1.18% | 3.84% | -0.94% | 0.20% |
| US | 10.30% | 0.26% | 5.31% | 4.48% | 0.92% |
| Japan | 19.17% | 0.80% | 7.86% | 9.63% | 2.69% |
| Europe ex UK | 8.26% | 0.62% | 6.25% | 1.28% | 1.75% |
| Asia Pacific ex Japan | 4.66% | 0.57% | 7.62% | -3.28% | 2.13% |
| Emerging | 2.44% | 0.54% | 7.36% | -5.08% | 3.12% |
Source: Morningstar
Across all regions, we saw that a positive return in the change in valuation was a significant contributor to returns. Re-rating of stocks continues to drive returns ever higher. There were however some good sources of return from growth in earnings, particularly in Japan and the US. This underlying growth in earnings is pleasing to see as it helps underpin some of those higher valuations. The story was different however in the UK, developed Asia and Emerging markets where earnings were negative over the quarter with any positive return derived from re-rating rather than fundamentals. Of the developed regions the UK was the worst performer. As long as earnings continue to fall (as they did in 2023) there is little hope that UK stocks will re-rate substantially and returns from the region will be depressed.
We do feel that at present valuations, equity prices are elevated and that there is more risk to the downside. We feel that given more of our recent returns has been driven by these valuation increases rather than earnings growth that this is not conducive to further long-term equity price increases, although momentum has a funny way of persisting in markets so they may well rally for longer than expected.
Lastly gold had a good quarter gaining 8.24%. While it is almost impossible to forecast the gold price clearly, short-term geo-political concerns have helped strengthen the asset class. A less favourable outlook on rates and inflation has probably also added to the strength in the price which is now comfortably over $2,200 an ounce, an all-time high.
Portfolio performance
Your portfolios generated positive returns over the quarter, with higher risk portfolios outperforming lower risk portfolios. The table below shows the quarterly returns for Active, Passive, Sustainable, and Income portfolios, alongside the returns of their respective inflation benchmarks and for comparison purposes their appropriate IA sector.
| 3 Months to 31 March 2024 | Active | Passive | Sustainable | Income | Inflation Benchmark | IA Sector |
| Defensive | 1.70% | 1.71% | 1.88% | 0.46% | ||
| Cautious | 2.46% | 2.76% | 2.78% | 1.66% | 0.70% | 1.45% |
| Balanced | 3.65% | 4.26% | 4.06% | 2.66% | 0.94% | 2.51% |
| Growth | 4.62% | 5.51% | 5.31% | 3.43% | 1.19% | 4.15% |
| Adventurous | 5.68% | 6.93% | 6.47% | 1.43% |
Source: Morningstar
Portfolios with higher weights to equity performed better as equity markets rallied and bond markets fell. However, the rally in equity markets, coupled with positive returns from our credit funds, was enough to produce strong returns across all risk profiles. All portfolios were ahead of their inflation benchmark over the quarter and were ahead of the relevant IA sector as well. The exception is the Income Growth portfolio which was slightly behind the IA sector due to its value exposure and UK bias. The Passive portfolios outperformed the Active portfolios over the quarter. The Sustainable portfolios were ahead of the active, and slightly behind the passive. Those portfolios with a higher weight to the UK, such as Income, lagged those portfolios with a slightly higher weight to the US.
The chart below shows the returns of funds within the portfolios for the quarter.

Source: Morningstar
The vast majority of our funds provided positive returns over the quarter. The exceptions were our two sovereign bond fund trackers which fell during the quarter along with the market. All of our investment grade credit funds gained some return over the quarter with some of our shorter-dated credit funds performing well in both absolute and relative returns.
On the whole, our equity funds lagged behind their passive counterparts. Global and US funds were the strongest performers and our global funds performed mostly in line or slightly ahead of global equities, except those with an overweight to the UK. Here we can see our growth bias helping with performance as growth outperformed value globally. This was not the case however in the UK where both Evenlode Income and Lindsell Train UK underperformed the index by some margin as idiosyncratic stock picks hampered growth. Both their overweight to UK consumer staples and consumer discretionary stocks was also a source of underperformance.
We remain committed to our equity growth bias within portfolios, not least because the majority of our funds have continued to report that their underlying holdings have on average grown their earnings over the year. We invest for the long-term growth in earnings rather than try to trade the valuation cycle.
Portfolio outlook
We made significant changes to all our portfolios in late January. Across all portfolios, we added to our sovereign debt position by reducing cash and investment-grade credit. Within sovereigns we moved from our short-duration position to an average duration position, splitting our sovereign exposure equally between UK government bonds and currency hedged US treasuries. While we expect no rate cuts till the second half of 2024 we wish to be positioned for potential positive returns from any cuts should we be wrong on this call. Until we get rate cuts we feel that the bond market will move sideways and thus far the returns after we rebalanced the portfolios reflects this view.
We made no changes to our equity allocation but we did change some funds, selling one underperforming fund, Liontrust Special Situations, on liquidity concerns and buying Royal London Sustainable leaders in the Active portfolios. Elsewhere there was little change to the portfolios.
We now believe that the portfolios are positioned correctly for what we feel will be a slow rate cutting cycle over the next three to five years. We should benefit from both rate cuts and the diversification that average duration sovereign debt will afford us should economies slow and enter recession.
Find out how One Four Nine Portfolio Management invest here.
Dr Bevan Blair,
Chief Investment Officer,
One Four Nine Portfolio Management
London, Thursday 25 April 2024.
All investment views are presented for information only and are not a personal recommendation to buy or sell. Past performance is not a reliable indicator of future returns, investing involves risk and the value of investments, and the income from them, may fall as well as rise and are not guaranteed. Investors may not get back the original amount invested.
All data is at 31 March 2024. One Four Nine Models are benchmarked against UK CPI and any other benchmark has been displayed for comparative purposes only and is not a benchmark for the Models. Performance figures are net of underlying fund fees and include One Four Nine Portfolio Management’s Management Fee of 0.20%. All model portfolio performance data is sourced from One Four Nine Portfolio Management. All other data is from Bloomberg and Morningstar.
This service is intended for use by investment professionals only. This document does not constitute personal advice. If you are in doubt as to the suitability of an investment, please contact your adviser.
One Four Nine Group Limited Registered in England No: 11866793. One Four Nine Portfolio Management Limited is registered in England No: 11871594 and is authorised and regulated by the Financial Conduct Authority (FCA) FRN: 931954. One Four Nine® is a registered trademark.