Portfolio Review – Q2 2021 – Issue 11
This is the latest One Four Nine Portfolio Management (OFNPM) portfolio review providing investors and advisers with an easy to digest overview of what’s happening in the markets globally, alongside comparisons of OFNPM’s portfolio performance each quarter and throughout the year.
Chief Investment Officer’s comments
The second quarter of the year proved to be a fruitful one for equity investors, despite concerns about growth, inflation, the never-ending pandemic, with patchy but improving vaccine rollouts, and the inexorable rise of the Delta variant of the virus globally. The UK market gained 5.6% while the US market gained 8.4% in sterling terms. European equities were equal to the measure rising 8.1% but Japan lagged somewhat falling 0.5% over the quarter. Finally, Asia Pacific ex Japan equities advanced 3.8% and Emerging Equities gained 4.9%. While the first quarter was all about the resurgence of value stocks, the second quarter saw growth stocks significantly outperform their value counterparts, with growth stocks rising 10.0% over the quarter against value stocks rising 4.8%. Overall, the MSCI World in sterling terms rose 7.6%.
Fixed income markets reversed some of their losses from the first quarter with yields slowly moving downwards. In the UK, the 10-year Gilt yield fell from 0.85% to 0.72% over the quarter. In the US the 10-year treasury yield fell from 1.74% to 1.47% while in Germany the Bund yield actually rose slightly from -0.29% to -0.21%. In Japan, the ten-year JGB yield fell from 0.1% to 0.06%. Gilts returned 1.8% over the quarter, sterling investment grade credit gained 2.0% and sterling high yield 1.8% with spreads remaining largely unchanged. In the US treasuries gained 2.0% and European government bonds lost 0.7%.
Commodities
These historically low bond yields do not suggest a bond market that is bullish about future economic growth, far from it. However, in the short-term the commodity markets continue to price in increased demand expectations, with raw commodities and in particular oil and industrial metals posting strong returns over the quarter. Oil gained over 18.3% during the quarter, with Brent Crude rising from $63 a barrel to $75, while heating oil and natural gas gained just over 20% and 39% respectively. Copper and Zinc gained 6.1% and 5.4% respectively while Aluminium, Lead and Nickel all posted returns in excess of 14%. Commodities in general gained 13.3% as measured by the Bloomberg commodity index, the fifth straight quarter of growth and the longest run the index has had on a quarterly basis since 2002/03. Having reached a twenty-year low in March of 2020 the index is now back at levels last seen in 2015.
This increase in commodity prices has had a stark effect on producer inflation. The PPI in the US in June recorded a 7.3% year on year increase while the PPI in the UK came in at 9.1%. These are close to all time highs for a year-on-year change in these input indices and are a result of delayed demand and consumption from lockdowns being released as economies reopen globally.
Inflation
This has had a knock-on effect on consumer prices. In the UK, the CPI index delivered a 2.5% annual increase in June, while in the US the CPI recorded a 5.4% increase, both above their central bank targets. This increase had been well anticipated by the bond market however with significant increases in global inflation expectations in the first quarter. In the US inflation expectations increased from 2.0% to 2.4% over Q1 with similar moves in the UK (3.0% to 3.6%) and Europe (0.9% to 1.3%). In the second quarter inflation expectations either stalled or reversed slightly, with inflation linked breakeven rates settling at 2.3% in the US, 3.5% in the UK and 1.3% in Europe at the end of June.
These increases in inflation have got some commentators worried. The theory would go that as vaccine programmes took effect and economies reopened, internally and externally, that pent-up demand from the consumer and business alike over the pandemic would be unleashed and this would cause demand driven inflation. This in turn would have an effect on wages with wage-push inflation returning. We have seen some short-term wage inflation in the UK, driven partly by labour shortages in certain sectors, however, it is a fact that real wages are only 1% above their 1999 levels. That is not 1% annualised, that is 1% over 20 years – or a wage inflation rate of just 0.05%. We have had over a generation of no wage increases, and it is unlikely we will do so again soon and see wage-push inflation rear its ugly head.
Central banks and governments have taken the view that this increase in the inflation rate is transitory and that it will more than likely come back to more acceptable levels fairly shortly once base effects from 2020 have worked their way out of the system. Most central banks offer subdued growth and inflation outlooks in the medium-term and reiterate their commitment to not raise base rates until the pandemic is truly over. Governments continue to keep the fiscal tap open to keep their respective economies afloat, and this worries the inflation hawks. The market disagrees.
Portfolio performance
Your portfolios generated strong positive performance over the quarter. The portfolios could be categorised as having a large cap quality growth bias, and this style was somewhat out of favour as the markets reacted to vaccine availability in Q4 2020 and Q1 2021. This “trade” has now clearly petered out with “Growth” stocks rising 10.0% over the quarter against “Value” stocks rising 4.8%. Over the past year growth stocks gained 39.7% and value stocks 38.4% as measured by MSCI AC World Indices. There was little value in being in one style or the other – just value in being in good companies.
The table below shows returns for Active and Passive portfolios, alongside the returns of their respective inflation benchmarks and for comparison purposes their appropriate private client ARC index over the second quarter.
| Active | Passive | Inflation Benchmark | ARC Index | |
| Defensive | 3.00% | 2.40% | 1.56% | |
| Cautious | 3.74% | 2.95% | 1.80% | 2.31% |
| Balanced | 5.32% | 4.23% | 2.03% | 3.53% |
| Growth | 6.60% | 5.18% | 2.26% | 4.44% |
| Adventurous | 7.90% | 6.11% | 2.50% | 5.36% |
Our Active portfolios outperformed both the Passive portfolios and the ARC indices over the quarter. Good fund selection made up the bulk of the outperformance of the Active portfolios over ARC, but our Passive portfolios also outperformed the ARC indices which implies some extra return from our tactical asset allocation.
The chart below shows the returns of funds within the portfolios for the quarter.
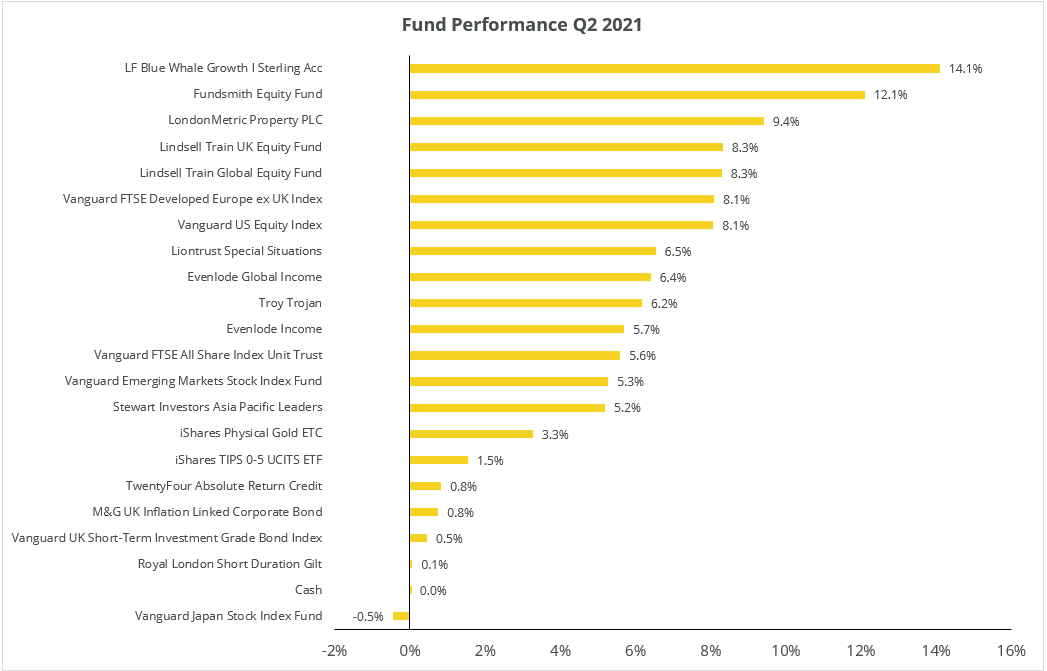
The five top performers in the active portfolios were:
- Blue Whale Growth (+14.1%)
- Fundsmith Equity (+12.1%)
- LondonMetric (+9.4%)
- Lindsell Train UK Equity (+8.3%)
- Lindsell Train Global (+5.3%)
The bottom five performers in the Active portfolios were cash and our four fixed income funds. All but one of the equity funds outperformed their respective markets over the quarter, with the portfolio of active equity funds returning 8.3%, while its passive equivalent returned 6.4%. Moreover, our active equity funds realised a slightly lower volatility over the quarter of 7.2% against 7.5% for the passive equivalents.
Since launch, at the beginning of 2019, our active equity fund selection has returned 41.4%, while its passive equivalent has returned 37.2%. While outperformance is pleasing, it is the part of investment returns that we can least control. Within our control is the risk that the underlying fund’s investment processes allow them to take. Here we have seen outstanding results. The volatility of the active equity portfolio has been 11.8% since inception, but its passive equivalent has realised 15.0% (for comparisons sake the MSCI World has a realised volatility of 20.1%). During the initial market crash at the outset of the pandemic our active equity portfolio fell 24%, while the passives fell 28%, evidence our active managers offered us some protection and reduced risk compared to passives.
Both portfolios bottomed out on 23 March 2020. The Active portfolio had recovered all these losses by 14 October 2020, yet it took the Passive portfolio nearly two months more to recover its losses by 7 December 2020. All this while the Active portfolio was adding positive performance. In the long run, protection of capital is key to generating superior risk adjusted performance.
At OFNPM we like to look through the funds to understand what companies we hold and to evaluate where any concentration risks may lie. The table below shows the top 10 companies held by our fund managers, their ultimate weight, and their performance in the last quarter.
| Equity | Region | Weight | Number of Funds Held by | Q2 2021 Performance |
| Unilever | UK | 4.04% | 7 | 4.3% |
| Diageo | UK | 3.59% | 6 | 15.8% |
| Microsoft | US | 3.54% | 7 | 14.9% |
| RELX | UK | 3.08% | 5 | 5.5% |
| Intuit | US | 1.92% | 6 | 28.0% |
| Visa | US | 1.87% | 5 | 10.4% |
| London Stock Exchange | UK | 1.67% | 3 | 14.8% |
| PayPal | US | 1.66% | 4 | 20.0% |
| Sage | UK | 1.62% | 4 | 11.7% |
| Hargreaves Lansdown | UK | 1.36% | 3 | 3.1% |
It is interesting to me that even with a quite concentrated list of equity funds (we have just 12 equity funds in the portfolio), and with our funds also quite concentrated (on average they hold 38 stocks), you get quite a dispersal at the stock level. The top 10 holdings account for only 24% of the weight in the portfolio. If diversification is your thing, then there is plenty of it in the portfolios at the stock level. Most of our top stocks had very strong performance over the quarter with no one stock dominating. The sign of good risk management.
Portfolio outlook
We made significant changes at the end of the quarter adding three new funds, Brown Advisory US Sustainable Growth, Brown Advisory Global Leaders Sustainable Fund and Matthews Asia Pacific ex Japan Dividend Fund. We sold our only holding in commercial property, LondonMetric. We also rebalanced our equity asset allocations reducing the UK in favour of the US, Europe, and Emerging Markets. Our rationale for this is contained in our rebalance note (circulated 30 June 2021). Overall, our long-term outlook remains unchanged.
- The world is in a secular disinflationary environment. Some short-term inflation is expected due to demand/supply imbalances
- Equilibrium rates will be at far lower levels than they were pre GFC for much longer. Covid-19 has compounded this. Real rates will remain negative
- We must adjust to permanently lower risk premia. We get paid less for taking on the same risk
- Monetary policy is now ineffective as a tool to combat future recessions
- Fiscal policy will have to take up the slack with ever expanding Government balance sheets
- Fiscal policy will remain loose for much longer to combat the effects of the Covid-19 pandemic
- Global demand and growth will remain weak while Covid-19 remains a risk to global health
- Outlook for fixed income is poor with large amounts of negative yields. Trade is on a greater fool theory
- Equities still provide resilience but only those companies with strong balance sheets, good cash flows, strong brands and barriers to entry will provide long-term value
Find out how One Four Nine Portfolio Management invest here.
Dr Bevan Blair,
Chief Investment Officer,
One Four Nine Portfolio Management
London, Tuesday 27 July 2021.
All investment views are presented for information only and are not a personal recommendation to buy or sell. Past performance is not a reliable indicator of future returns, investing involves risk and the value of investments, and the income from them, may fall as well as rise and are not guaranteed. Investors may not get back the original amount invested.
All data is at 30 June 2021. One Four Nine Models are benchmarked against UK CPI and any other benchmark has been displayed for comparative purposes only and is not a benchmark for the Models. Performance figures are net of underlying fund fees and include One Four Nine Portfolio Management’s Management Fee of 0.24% (including VAT). All model portfolio performance data is sourced from One Four Nine Portfolio Management. All other data is from Bloomberg and Morningstar.
This service is intended for use by investment professionals only. This document does not constitute personal advice. If you are in doubt as to the suitability of an investment, please contact your adviser.
One Four Nine Group Limited Registered in England No: 11866793. One Four Nine Portfolio Management Limited is registered in England No: 11871594 and is authorised and regulated by the Financial Conduct Authority (FCA) FRN: 931954. One Four Nine® is a registered trademark.