Portfolio Review – July 2020 – Issue 05
This is the latest One Four Nine Portfolio Management (OFNPM) portfolio review providing investors and advisers with an easy to digest overview of what’s happening in the markets globally, alongside comparisons of OFNPM’s portfolio performance each quarter and throughout the year.
Chief Investment Officer’s comments
Towards the end of July we saw a flurry of GDP releases from western economies and they confirmed what markets had expected.
As economies shutdown to contain the spread of Covid-19, GDP fell hard. In Europe, GDP fell between 9% (Germany) and 22% (Spain) for Q2. In the US GDP fell 9.5% for Q2. But the spectacular failure in all of this was the UK where GDP fell just over 20% for Q2. There appears to be a correlation between the severity of the fall in GDP and an economies reliance on tourism and consumption.
In the UK consumption is the largest component of GDP, by a long way, and our ability to consume was severely curtailed, so the fall should come as no surprise. As the economy reopens, and if the spread of the virus is contained, then we should see a rebound in GDP.
However, that fall of 20% could take a long time to recover, even if we get significant rebounds in the next 2 quarters.
To put the fall in context the UK economy grew by 20% from December 2009 to December 2019, so a decade’s worth of growth was wiped out in a single 3-month period. But its slightly worse, because a 20% rise followed by a 20% fall means that you are actually under water by 4%.
Coupled with Q1 GDP growth of -2.2%, the economy is now 6% smaller than it was at the end of 2009. You have to go back to December 2003 to find an economy smaller than what we have now.
It is clear though that the world economy is staging some kind of comeback.
In the US job losses, although large, are reversing. Unemployment stands at 11% and underemployment (those who would like to work more) is at 18%, but both these are down on 3 months ago (the US has lost 15 million jobs since the start of the pandemic).
Factory and durable goods orders have grown more than expected as have advanced retail sales, although manufacturing confidence has slipped slightly and consumer confidence has stabilised.
Yet no respite
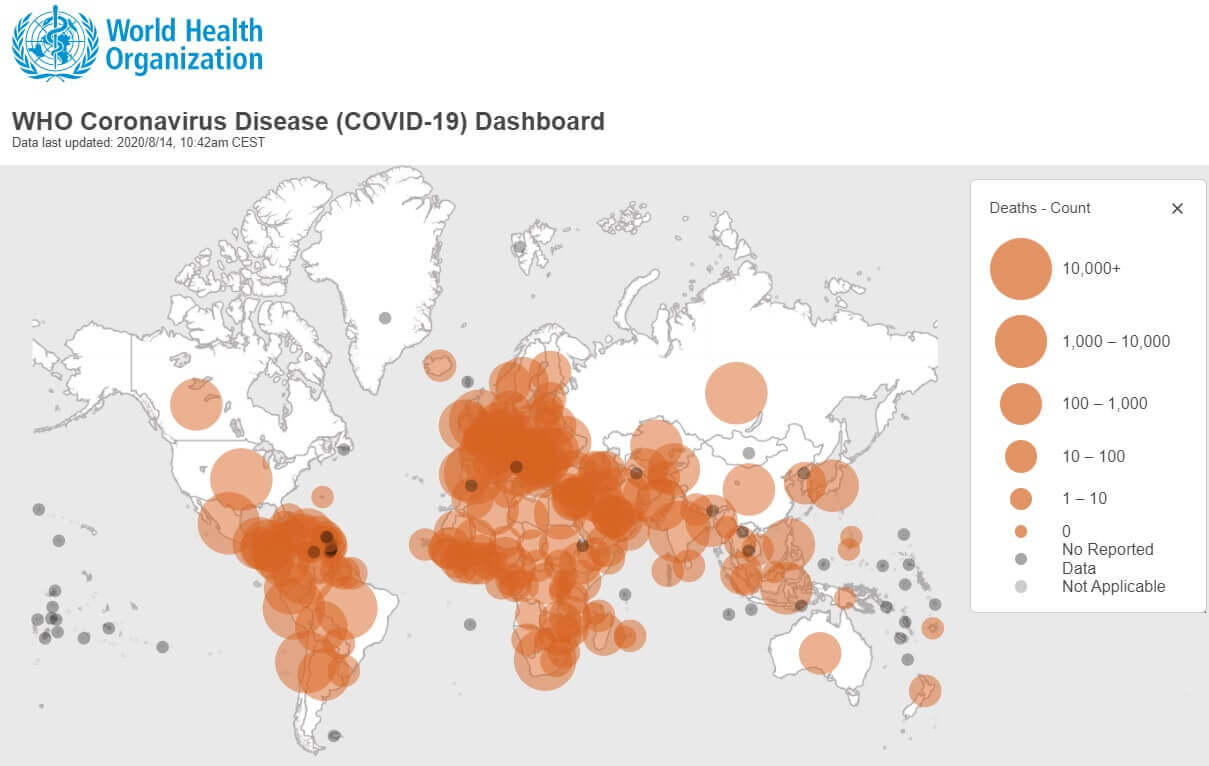
And yet the virus seems to grow unabated despite our best intentions and interventions globally.
 Worldwide we now see an average of a quarter of a million cases a day, or a million cases every 4 days. At the end of June it was a million cases every week. There is clear acceleration and India, Brazil, South Africa and the US are the largest contributors.
During July the US recorded nearly 2 million new cases, almost doubling the total cases recorded
thus far. And deaths are accelerating with the US averaging over 1,000 deaths a day, while globally it is closer to 6,000.
In Europe we have also seen an increase in cases after the prevalence of the virus fell to low levels.
Clearly if you open back up then the wee beastie can get a foothold, and once it does it can accelerate, resulting in localised lockdowns to keep a lid on it.
So, is it a straight trade-off between interventions to stop the virus spread and keeping the economy open?
Not necessarily as some research suggests that if policy is insufficient to stop the spread then both public health and the economic output decline together. Economies need to function more than they have and we have to learn to live with the virus while we wait for a vaccine or better therapeutic interventions. Social distancing, masks and handwashing will become the norm, and some sectors, in particular tourism and hospitality, will bear the brunt for years to come.
The markets
So, what of the markets?
In July equity markets around the globe responded quite differently. The UK equity market was down 4.5%, but the US market was up over 5%. Japan suffered a fall of nearly 8%, but Europe gained 1.5%. Asian and Emerging markets gained 1.6% and 2.5% respectively.
This dichotomy of returns was driven by US dollar weakness. The dollar depreciated 5.5% against sterling, resulting in the UK market suffering falls as US dollar earnings make up a large proportion of the market meaning the value of these earnings in sterling terms fell.
The dollar also weakened 4.8% against the Euro and 2% against the Yen. This “dollar dumping” could be seen as a positive signal as investors left the safe haven currency. But then we have gold which touched over $2,000 an ounce for the first time ever and gained over 10% during July. This is a sign that investors are nervous.
The markets: So, who is right?
Well, no one knows.
The US market continues to power up, yet earnings fall, although not for the new darlings of the index, the ubiquitous FAANGs (Facebook, Amazon, Apple, Netflix, Google – and add Tesla and Zoom into the mix) whose earnings are surging.
As I have said before the market is not reacting to the underlying economic conditions or in fact the earnings fundamentals of the underlying stocks. It is reacting to the massive fiscal stimulus the US government has provided this year and to a certain extent the liquidity that the Fed has provided the market.
In the 6 months to June the net deficit run by the treasury was $2.4 trillion. In the 6 months to June 2019 this figure was $0.4 trillion. At the height of the financial crisis the treasury never ran a deficit of more than $0.8 trillion over any 6-month period. The total US debt has now increased to just over $26 trillion from $23 trillion 4 months ago, a 10% increase in the total debt in just 4 months. These are staggering amounts, and they are keeping the market buoyant.
The Fed balance sheet has almost doubled over the same period from $4 trillion to nearly $7 trillion. The two combined implies that over $5 trillion dollars has been thrown at Covid-19 since March. Any reduction in this government support will be disastrous to markets. Actually, you could argue that the last 20 years of market movements have been driven by the state and not the private sector.
The US Debt has quadrupled since 1999, when it stood at around $5 trillion. All those interventions have been expensive. The Fed has been at it too with its balance sheet going from $1 trillion to $7 trillion. All this quantitative easing has forced down interest rates and returns on equity, and so discount factors have been floored. This means that future cashflows are much more valuable, because you discount them at a lower multiple and so valuations rise. Hence markets have powered on.
Portfolio comparison
During July your portfolios posted moderate gains which was pleasing as most private UK portfolios lost money. The active portfolios significantly outperformed the passive portfolios and the ARC estimates for July. Most of our funds posted positive returns for July, and almost all our equity funds outperformed their respective markets. Our 3 UK equity funds outperformed the UK market, with Lindsell Train gaining 0.5%, while the market fell 4.5%. The returns for July are shown in the table below.
| OFNPM Portfolio | Active Portfolio | Passive Portfolio | ARC PCI Index |
| OFNPM Defensive | 0.80% | 0.08% | 0.00% |
| OFNPM Cautious | 0.64% | -0.22% | 0.00% |
| OFNPM Balanced | 0.39% | -0.73% | -0.40% |
| OFNPM Growth | 0.16% | -1.23% | -0.90% |
| OFNPM Adventurous | -0.22% | -1.87% | -1.20% |
| MSCI UK | -4.53% | ||
| MSCI World GBP | -1.36% |
Over the year thus far the active portfolios have significantly outperformed the passive and the ARC estimates for the year.
| OFNPM Portfolio | Active Portfolio | Passive Portfolio | ARC PCI Index |
| OFNPM Defensive | -0.11% | -1.25% | -0.57% |
| OFNPM Cautious | -0.65% | -2.44% | -0.57% |
| OFNPM Balanced | -0.91% | -3.84% | -3.01% |
| OFNPM Growth | -2.04% | -6.14% | -5.19% |
| OFNPM Adventurous | -2.55% | -8.17% | -6.70% |
| FTSE All Share | -21.45% | ||
| MSCI World GBP | -8.70% |
 Fund in focus: Londonmetric Property PLC Fund in focus: Londonmetric Property PLC
This is the first in a part time series focussing on one of our core holdings in the portfolio. This month we look at UK Commercial Property. This sector has been ravaged by the Covid-19 crisis, in particular office and retail commercial property. Moreover most investors have had exposure to the sector via open ended property funds, which have had to close, as redemptions have significantly exceeded available cash. Buildings take a long time to sell, especially in a market with little appetite, so investors cash has been stuck and will be for some time to come. And all the while there have been catastrophic falls in values. At One Four Nine we do not invest in open ended commercial property funds. After the 2016 Brexit vote they suffered a similar fate, and while that was short lived (most funds reopened after 6 months) it proved the mantra that you can never be more liquid than the underlying asset. The last thing we wish for is client’s capital to be “stuck”. Liquidity, however, does come at a cost, which is increased volatility and correlation with equity markets, but capital is accessible which is the trade-off. We invest in closed ended property funds and REITs in our portfolios to gain exposure to the commercial property sector. They have a much higher volatility and correlation with equity markets than their open ended cousins and so weights are adjusted accordingly in portfolios to reflect their extra appetite for the overall risk budget. In our portfolios we invest in LondonMetric Property PLC. This was formed between the merger of London & Stamford Property PLC and Metric Property Investments PLC in 2013. Its property portfolio is skewed heavily towards the distribution sector with over 67% of its revenues originating from that sector. Its exposure to the office and retail sectors is small with only 9% of its revenues derived from them. LondonMetric has a stated aim to increase its dividend annually and its divided is 110% covered by earnings. This year has been no different. The company announced an increased dividend in March with its dividend to June 2020 standing at 8.3p against a dividend to June 2019 at 8.2p. The current yield is 3.4% and dividend growth has averaged 3.5% per annum over the last 5 years. A company with a strong and growing dividend. In its June statement the company reported that its rent collection was high with 98% collected on time and that it was currently experiencing low voids. The share price has reacted accordingly. The total return year to date is -0.2%, while in July the share price gained 9.7% and is up 20.2% in the last 3 months. This is in contrast to the UK Commercial Property REIT sector as a whole which is down over 23% year to date and is up just 3.6% over the past 3 months. This significant outperformance in a sector that has been devastated by the current crisis is incredibly pleasing and is driven by the sound management of the firm, its strategy of focussing on smaller urban distribution hubs, and its clear and growing dividend policy. We continue to be happy long-term holders of this despite the bleak outlook for the rest of the sector. |
Find out how One Four Nine Portfolio Management invest here.
Dr Bevan Blair,
Chief Investment Officer,
One Four Nine Portfolio Management
London, Tuesday 18 August 2020.
The value of investments and the income from them may go down as well as up. You may not get back the amount you invest. The return may increase or decrease as a result of currency fluctuations. Past performance, or any yields quoted, should never be considered a reliable indicator of future returns.
All data is at 31 July 2020. One Four Nine Models are benchmarked against UK CPI and any other benchmark has been displayed for comparative purposes only and is not a benchmark for the Models. Performance figures are net of underlying fund fees and include One Four Nine Portfolio Management’s Management Fee of 0.24% (including VAT). All model portfolio performance data is sourced from One Four Nine Portfolio Management. All other data is from Bloomberg and Morningstar.
This service is intended for use by investment professionals only. This document does not constitute personal advice. If you are in doubt as to the suitability of an investment, please contact your adviser.
One Four Nine Group Limited Registered in England No: 11866793. One Four Nine Portfolio Management Limited is registered in England No: 11871594 and is authorised and regulated by the Financial Conduct Authority (FCA) FRN: 931954. One Four Nine® is a registered trademark.