Portfolio Review – Q4 2021 – Issue 13
This is the latest One Four Nine Portfolio Management (OFNPM) portfolio review providing investors and advisers with an easy to digest overview of what’s happening in the markets globally, alongside comparisons of OFNPM’s portfolio performance each quarter and throughout the year.
Chief Investment Officer’s comments
This is the fourth review of the year and it is the fourth where the overriding dominant feature of markets is inflation. In all geographies, apart from Japan, we continue to see a rising rate of inflation and these rises have been for the most part above market expectations. In both the UK and Europe inflation ended the year over 5% and ahead of expectations. In the US inflation settled at 7% for 2021 but was at least in line with expectations. These are well in excess of central bank targets, and the level of inflation, and the upside surprises in particular are getting them worried.
Consequently, the central banks have acted accordingly. In the UK the Bank of England (BoE) announced a surprise rise in its base rate from 0.10% to 0.25%. While this, in itself, will have little effect on the causes of inflation it is a signal to the market that the central bank is willing to act and is concerned about the upside surprises. The market is now pricing in a further four rate rises by the end of the year with the base rate sitting between 1.25% and 1.50%, a level not seen since before the Global Financial Crash (GFC) of 2008.
It is a similar picture in the US. The Fed did not change its target rate but has begun tapering its asset purchase programme. However, in December the Fed gave very clear guidance to the market that it will look to raise rates next year at least three times. This month it updated that guidance, which was even more hawkish in its outlook, suggesting five rate rises with one as early as February 2022, which the market has now priced in. In the US this would leave the target rate at 1.5%, which is still lower than where the rate was in the middle of 2019.
An aggressive stance
There may be good reason for the market pricing such an aggressive stance into their thinking. Early inflation increases were driven by a myriad of reasons, including base effects dropping out deflation from 2020, a surge in aggregate demand from economies reopening, a rebound in the input prices of commodities, especially energy, a rebound in wage levels, which had been repressed during 2020, and lower than expected unemployment. We would expect these factors to dissipate as the economy returns to something resembling normality, and therefore the rate of inflation to ease back towards target.
However, the single biggest factor in rising inflation has been an unprecedented short-term expansion of government deficits to help plug the demand driven hole in economies from shutdowns. The support governments have given and are continuing to give their economies has helped fuel inflation, not least because the borrowing has been funded by central bank balance sheet expansion, not by conventional borrowing.
It shows no sign of abating. In the UK we borrowed £263 billion in 2020 and in 2021 it has been estimated that we have borrowed a further £183 billion. That is £446 billion in total over two years. Between 2012 and 2019 total UK government borrowing was £445 billion! In the US it’s a similar picture, just replace the billions for trillions, with $4.5 trillion in 2020, followed by $1.9 trillion in 2021. Again, this is more than the US government borrowed between 2012 and 2019. This fiscal largesse, which was necessary, shows no real signs of slowing down and may be the single biggest factor in the failure of monetary policy to halt the rise of inflation.
Will this higher rate of inflation continue?
Last quarter we asked if this higher rate of inflation was set to continue and we said,
“To a certain extent we should see the headline rate remain high until at least summer of 2022. At this point the base effects of higher prices now will start to work their way out of the data if month on month changes revert towards more normal levels. I see no reason why in the long term this should not be the case. The headwinds of the last 30 years seem set to continue with demographics, globalisation and technological advances all set to be deflationary offsetting any short-term inflationary factors such as energy prices and wage increases.”
This is still our base case but the risks to this being wrong have increased, especially if governments continue to run higher than expected deficits. Unchecked government spending that isn’t for long term investment coupled with productivity gains, will be a long-term inflationary risk.
Moreover, in the UK there are now baked in increases to energy prices, rail fares and other regulated services based on higher levels of inflation last year that are yet to work their way into the headline rate. (And these use RPI as an inflation measure, which is always higher than CPI due to a quirk in its mathematical construction). An unintended consequence of higher inflation has been an increasing interest bill to the government from higher-than-expected coupon payments on index linked Gilts. This will put further pressure on short term spending commitments.
Growth stocks into value stocks
Turning away from Inflation I want to discuss what I think will be next biggest topic within markets this year which will be a cyclical rotation from growth stocks into value stocks and will bring into focus whether one is a “value” investor or a “growth” investor. The ultimate “value” investor was Ben Graham, but the value investors of today bear little resemblance to him. He sought to buy companies for the long term, with minimal debt and that offered a margin of safety. This margin of safety was defined as the difference between the market value of the stock and the intrinsic value of the stock, which was determined through thorough research and analysis by the investor. If you felt the intrinsic value of the stock was higher than what the market thought it was then you should buy that stock and hold it, re-evaluating your position periodically. However, this has seemed in my opinion to have morphed into the “value” investors mantra of just buying cheap stocks based on various spurious metrics, without reference to the underlying business.
Why do we buy and hold equities, or rather companies in our portfolios?
We equities because we want to participate in the cashflows they offer through their dividends and any potential growth in their cashflow. Ultimately it is the only way we as investors can participate in wider economic growth. We like to participate in a mixture of companies. Older well-established companies which have a proven track record of running their businesses in a sound fashion, newer companies that are still growing their market share, and very young companies that possibly are looking to disrupt older business models or are innovating in an exciting fashion.
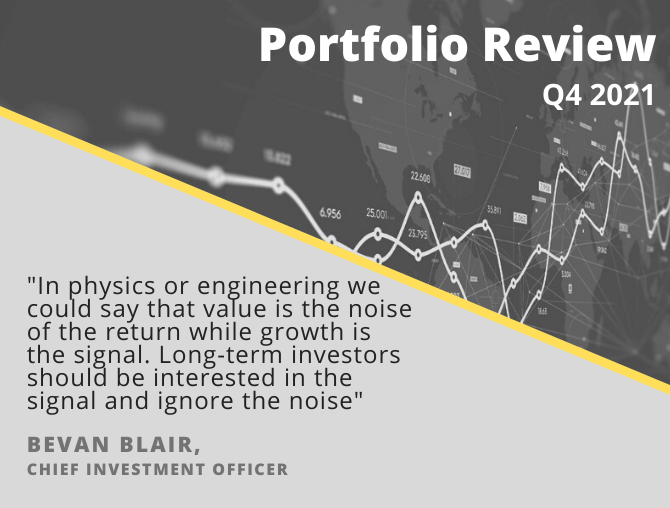
We can view the return from an equity, after dividends, as a combination of two components, value, and growth. The value component can be seen through its change an stock’s price to earnings (PE) ratio, while its growth component can be viewed as its change in its earnings per share (EPS). Analysis shows that in all markets the value component is much more volatile than the growth component. In physics or engineering we could say that value is the noise of the return while growth is the signal. Long-term investors should be interested in the signal and ignore the noise.
This same analysis shows that there is almost no, or very little return in the long run from the value competent and over 90% of the return is from earnings growth. Take the UK market for instance. The UK market, as measured by the MSCI UK Index, has returned just over 6.01% per annum since December 1969 after dividends. Decomposing the return into its value and growth components we see that nominal EPS has grown 6.07% p.a over the period while PE growth has been -0.06%. There has been no return in the “value” part of the return over the very long term. All value offers is volatility, because wrapped up in that measure is market sentiment, conjecture and rumours, while growth deals with more measurable fundamentals, the company’s earnings.
Example: Johnson and Johnson
There are times that stocks can look quite cheap. Over time though the return from value starts to get swamped by the return from growth. Take Johnson and Johnson (JnJ), one of the largest healthcare and consumer staples companies in the world. It is the third largest stock in the MSCI World Value index and is in the index because it has a low PE ratio, higher book to price ratio and higher dividend yield relative to other stocks. It is a stock that has continuously increased its dividends to shareholders over the last 60 years, has strong brands, has low levels of debt and is considered to be well run. The stock since March 1990 has returned 10.6% p.a. after dividends, of which growth in earnings accounts for 10.2% and change in PE just 0.3%. It is clearly not its “cheapness” that is driving its returns but the underlying growth in earnings.
Even if we bought the stock at its most expensive point in its history, we would still have generated a positive return. The PE of the firm peaked in August 1999 at 32 times earnings. If we had bought the stock at this point and held it to the end of 2021, when it was trading on 20 times earnings, we still would have made a return after dividends of 5.6% p.a. Of this the return from the value component was -2.6% p.a., but the return from growth in EPS was 8.3%, far outweighing the expensive nature of the stock.
Likewise, if we had bought the stock at its cheapest in February of 2009 when it was trading at 12 times earnings, we would have made 10.1% p.a., of which the value component returned 5.0% p.a. and growth component 4.8% p.a. So even at its very cheapest, growth in EPS still makes up about half your return.
This underlines how important growth in earnings is to the return we receive from owning a stock or a market. As Ben Graham said in the short-term markets are voting machines, but in the long-term they are weighing machines, and growth in earnings is that weight, which is why at One Four Nine we favour managers who invest in the long-term, prioritise growth in earnings, look for strong balance sheets and most of all understand the businesses they are invested in, and can see through the noise generated by the voting machine.
Portfolio performance
Your portfolios generated positive performance over the quarter. The table below shows returns for Active and Passive portfolios, alongside the returns of their respective inflation benchmarks and for comparison purposes their appropriate IA sector over the quarter.
| 3 Months to 31 December 2021 | Active | Passive | Inflation Benchmark | IA Sector |
| Defensive | 1.15% | 1.16% | 2.14% | |
| Cautious | 1.58% | 1.53% | 2.38% | 1.03% |
| Balanced | 2.71% | 2.72% | 2.61% | 1.88% |
| Growth | 3.63% | 3.71% | 2.84% | 2.78% |
| Adventurous | 4.64% | 4.81% | 3.08% |
Our active and passive portfolios delivered similar returns, suggesting little extra return from our active managers over the quarter. Both were significantly ahead of their respective IA sector averages. We benefited from our growth bias in equity markets and our higher weight to the US equity market. Sterling strength did temper these returns somewhat, however. While we did not benefit from the strength in the very long end of the sterling yield curve our short duration position, while producing a small negative return, shielded us from the volatility in the bond market as prices fell towards the end of the quarter.
The chart below shows the returns of funds within the portfolios for the quarter.
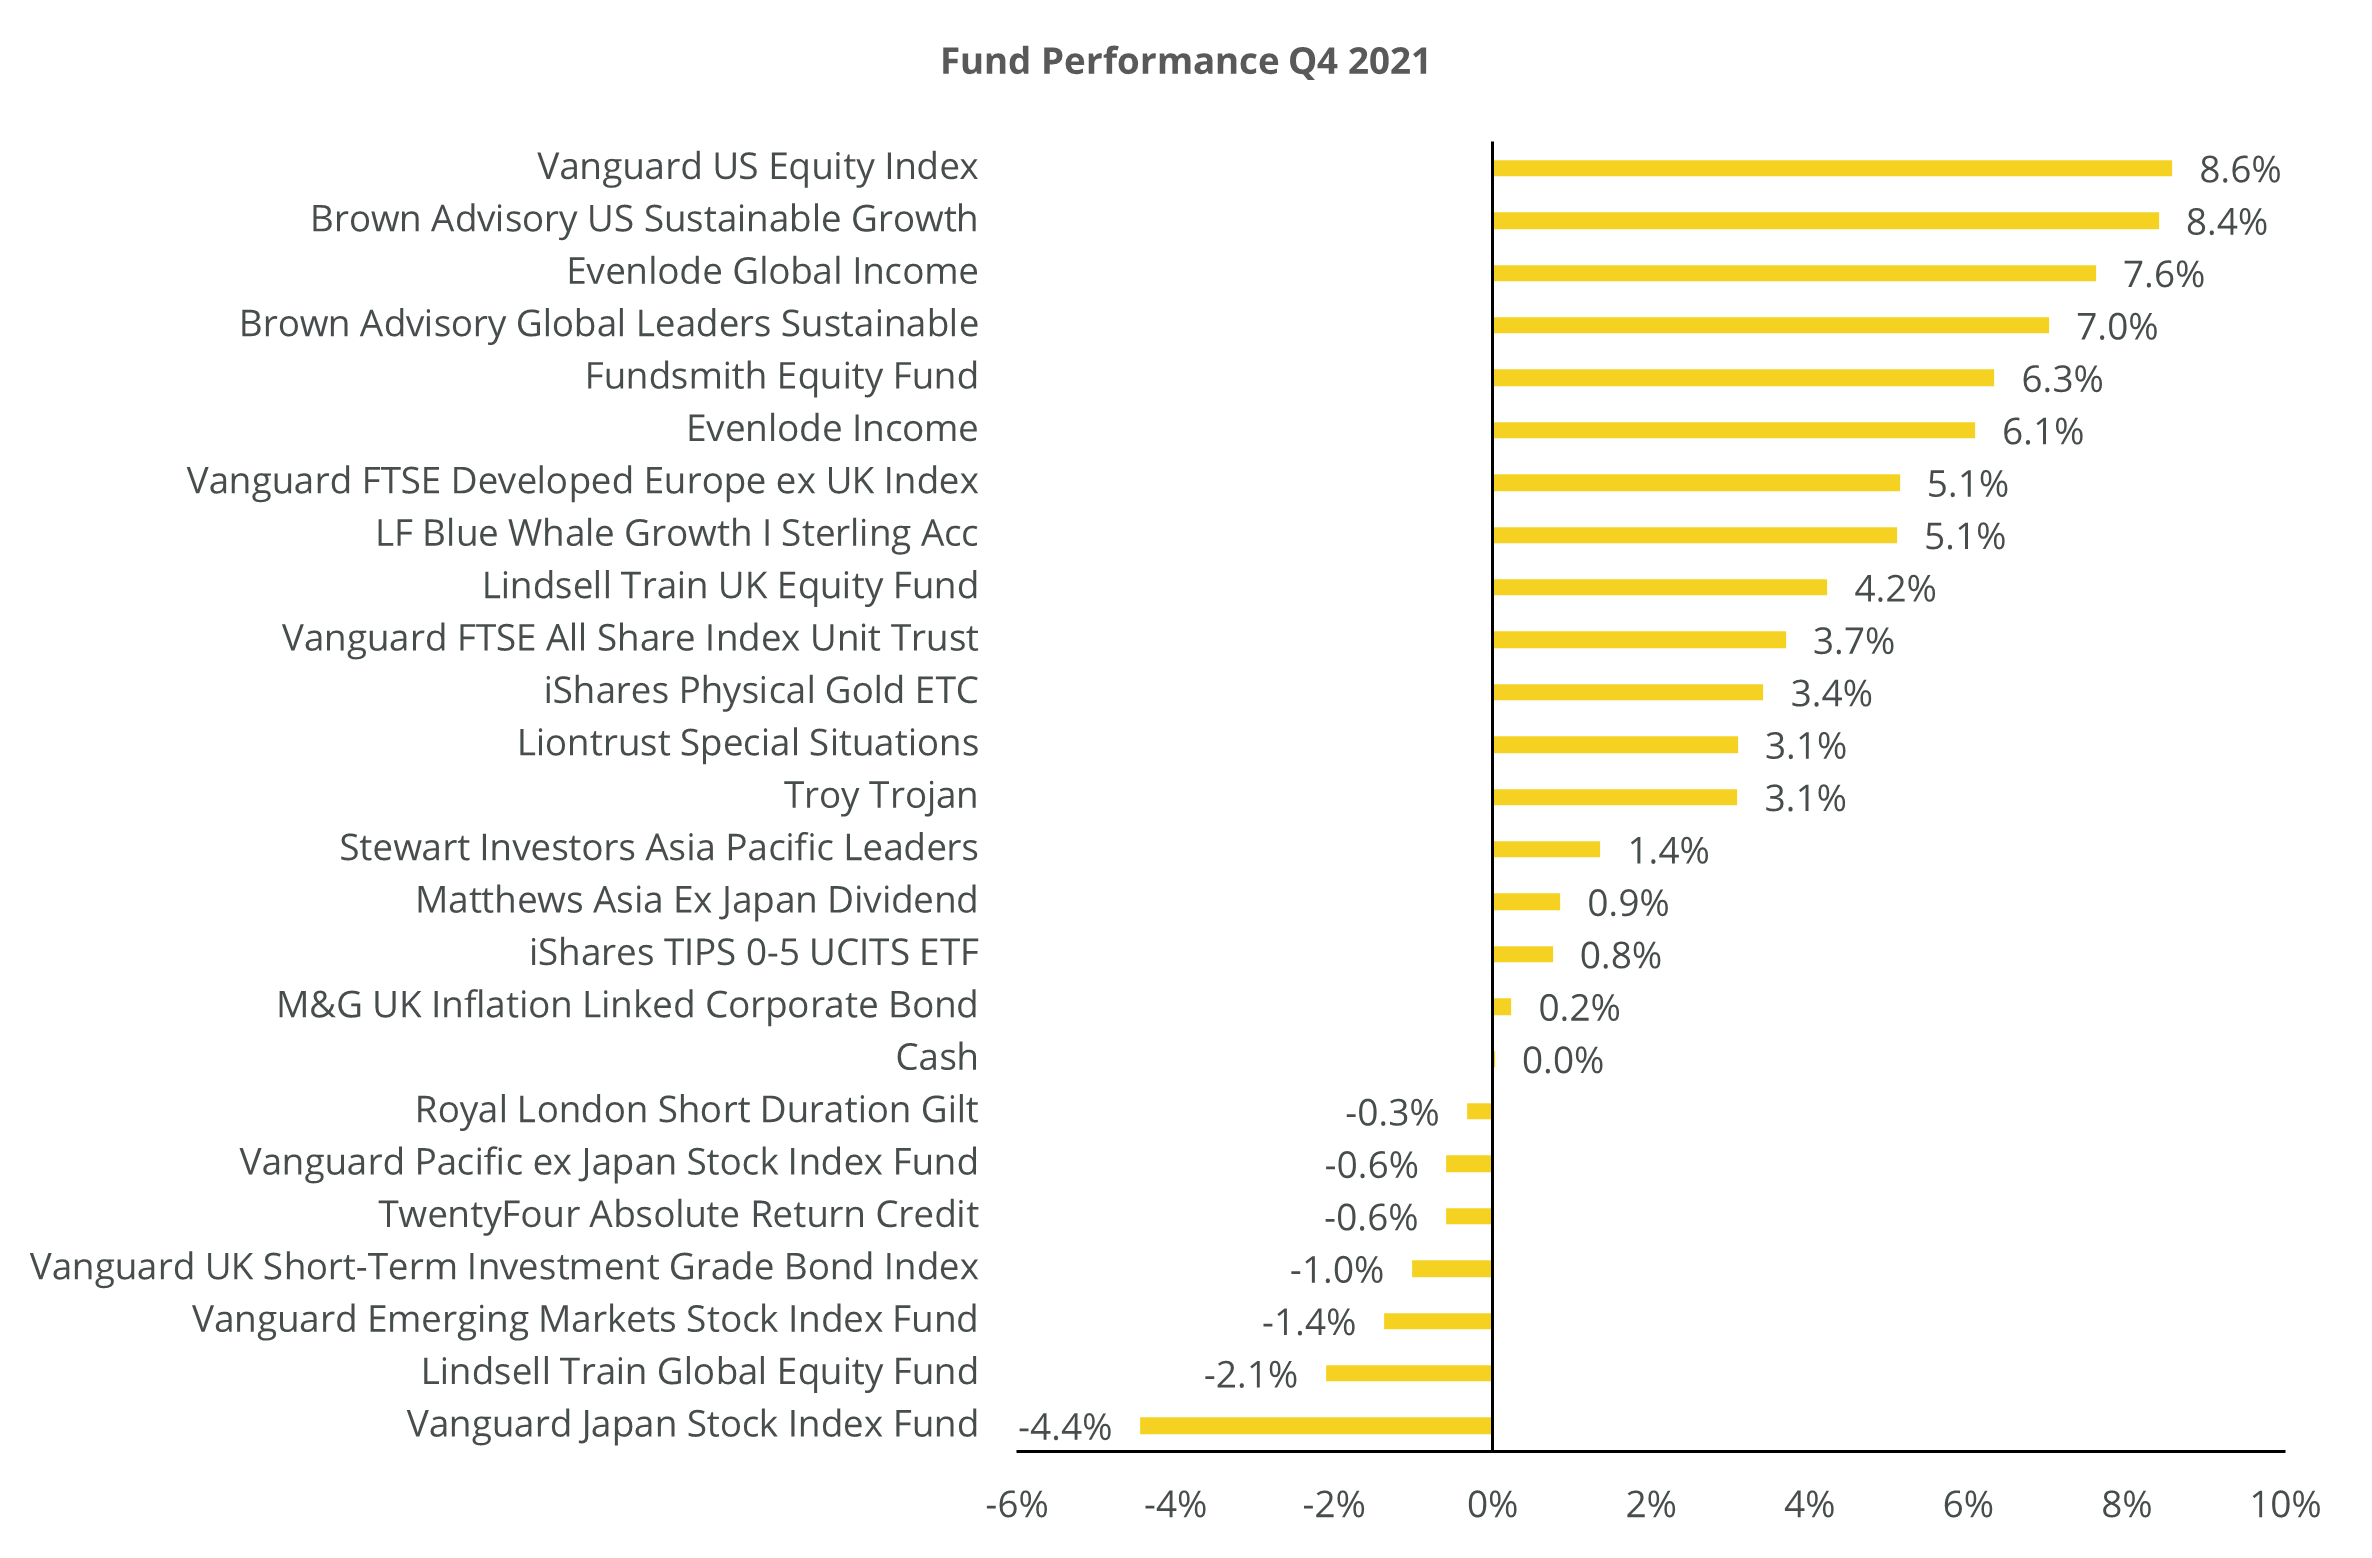
The five top performers in the active portfolios were:
- Vanguard US Equity Index (+8.6%)
- Brown US Sustainable Growth (+8.4%)
- Evenlode Global Income (+7.6%)
- Brown Global Sustainable Leaders (+7.0%)
- Fundsmith Equity (+6.3%)
Of our 11 active equity funds five outperformed their index, while six underperformed but only one fund realised a negative return. The active equity funds returned 4.9% over the quarter while their passive equivalents retuned 5.1%.
Our non-equity funds returned 0.2% over the quarter as our short duration bond funds delivered small negative returns. Our short duration Gilt fund fell 0.3%, whereas the wider Gilt market rallied 2.3% driven primarily by bonds with maturities in excess of 10 years, which delivered a return of over 4%. Our credit funds were mixed with Twenty-Four ARC and Vanguard UK Short Term Investment Grade falling 0.6% and 1.0% respectively, while the M&G UK Inflation Linked Corporate Bond Fund has a modest gain of 0.2%. The Sterling corporate bond market gained 0.6% over the quarter.
Portfolio performance in 2021
Equity markets over the year were strong across most geographies. The leader of the pack were US equities which posted returns of nearly 27% in sterling terms. This was particularly driven by its bias towards technology stocks, as US tech companies saw an increase of 31% on average over the year. Europe and the UK were significantly behind this, but still delivered strong returns gaining around 18% each over the year. Bringing up the rear were Japanese and Asian stocks. The Japanese market returned just 2% over 2021 while developed Asian equities fell 2%. Emerging markets also fared little better with the global index falling 1.6%, but within EM there was some divergence with EMEA returning 19% and Latin America falling 7%. World equities as a whole rose just under 23%. These returns were driven by economies recovering from their lows of 2020, the successful launch of vaccines for Covid underpinning this growth, and positive earnings trends for corporates.
Bonds however had a torrid time with Gilts falling just over 5.3% for the year and investment grade sterling bonds falling 3%. This has been only the fifth year out of the last 33 that we have experienced a negative total return from Gilts. It last happened in 2013 when central banks started to tighten monetary conditions after the great financial crisis. That cycle ended with 10 year Gilt yields reaching just over 3%. Currently the 10-year gilt yield is just under 1% and has a duration of around 9.5 years. A 200 basis point move up to 3% would result in a loss of over 19% in Gilts!
It is almost impossible to make money in the bond market in a rising rate environment, and with durations at such high levels, even small increases in yields are devasting to investors returns. Rate rises last year were driven mainly by market expectations of higher than target inflation, and towards the end of year, as we have seen, central banks beginning to enter a monetary tightening phase to combat this inflation. The one exception has been index linked Gilts, which produced a positive return, although this was still less than inflation (so a negative real return) and, towards the end of the year this began to unwind in quite a vicious fashion, especially at the long end. Given where we are in the rate cycle, the level of duration and the low yields we can expect lower returns for longer with much higher volatility from bond markets, even Gilts.
The portfolios over the year provided excellent risk adjusted returns, with all models producing positive returns with high Sharpe ratios. Moreover, they significantly outperformed their peer groups. The table below shows the performance.
| 1 Year to 31 December 2021 | Active | Passive | Inflation Benchmark | IA Sector |
| Defensive | 4.80% | 4.59% | 5.14% | |
| Cautious | 6.32% | 6.14% | 6.14% | 2.57% |
| Balanced | 10.17% | 10.29% | 7.14% | 6.28% |
| Growth | 13.23% | 13.72% | 8.14% | 11.10% |
| Adventurous | 16.62% | 17.46% | 9.14% |
Portfolio outlook
We made no changes to the portfolios over the quarter. Overall, our long-term outlook remains unchanged.
- The world is in a secular disinflationary environment. Some short-term inflation is expected due to demand/supply imbalances, but this should dissipate in the second half of 2022
- Equilibrium rates will be at far lower levels than they were pre GFC for much longer. Covid-19 has compounded this. Real rates will remain negative
- We must adjust to permanently lower risk premia. We get paid less for taking on the same risk
- Monetary policy is now ineffective as a tool to combat future recessions
- Fiscal policy will have to take up the slack with ever expanding Government balance sheets
- Fiscal policy will remain loose for much longer to combat the effects of the Covid-19 pandemic
- Global demand and growth will remain weak while Covid-19 remains a risk to global health
- Outlook for fixed income is poor with large amounts of low and negative yields. Trade is on a greater fool theory
- Equities still provide resilience but only those companies with strong balance sheets, good cash flows, strong brands and barriers to entry will provide long-term value
Find out how One Four Nine Portfolio Management invest here.
Dr Bevan Blair,
Chief Investment Officer,
One Four Nine Portfolio Management
London, Monday 31 January 2022.
All investment views are presented for information only and are not a personal recommendation to buy or sell. Past performance is not a reliable indicator of future returns, investing involves risk and the value of investments, and the income from them, may fall as well as rise and are not guaranteed. Investors may not get back the original amount invested.
All data is at 31 December 2021. One Four Nine Models are benchmarked against UK CPI and any other benchmark has been displayed for comparative purposes only and is not a benchmark for the Models. Performance figures are net of underlying fund fees and include One Four Nine Portfolio Management’s Management Fee of 0.24% (including VAT). All model portfolio performance data is sourced from One Four Nine Portfolio Management. All other data is from Bloomberg and Morningstar.
This service is intended for use by investment professionals only. This document does not constitute personal advice. If you are in doubt as to the suitability of an investment, please contact your adviser.
One Four Nine Group Limited Registered in England No: 11866793. One Four Nine Portfolio Management Limited is registered in England No: 11871594 and is authorised and regulated by the Financial Conduct Authority (FCA) FRN: 931954. One Four Nine® is a registered trademark.