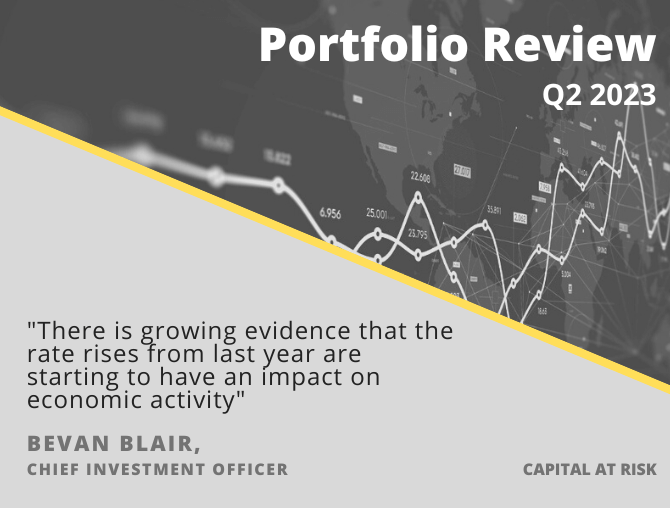
Portfolio Review – Q2 2023 – Issue 19
This is the latest One Four Nine Portfolio Management (OFNPM) portfolio review providing investors and advisers with an easy to digest overview of what’s happening in the markets globally, alongside comparisons of OFNPM’s portfolio performance each quarter and throughout the year.
Chief Investment Officer’s comments
Inflation continues to dominate the macroeconomic landscape as it has since mid-2021. While the headline rate of inflation is falling globally it is not falling as fast as expected, especially in the UK, and this continues to worry central bankers everywhere. Inflation itself is not a problem when it is high as long as it is behaving as expected. What has been the problem for central bankers is that inflation has continued to surprise on the upside. The table below shows the expected inflation figures for the UK each month this year and the inflation that we actually endured.
| Release Date | Date | Expected | Actual | Upside Surprise |
| Jan-23 | Dec-22 | 0.3% | 0.4% | 0.1% |
| Feb-23 | Jan-23 | -0.4% | -0.6% | -0.2% |
| Mar-23 | Feb-23 | 0.6% | 1.1% | 0.5% |
| Apr-23 | Mar-23 | 0.5% | 0.8% | 0.3% |
| May-23 | Apr-23 | 0.7% | 1.2% | 0.5% |
| Jun-23 | May-23 | 0.5% | 0.7% | 0.2% |
| 2.2% | 3.6% | 1.4% |
In five of the six months, this year inflation has been higher than expected which has left the Bank of England (BOE) flat footed. Interest rate rises have not worked as expected on inflation if the upside surprises are anything to go by. Inflation is currently stubbornly sticky and more so than the BOE thought.
Inflation is the driver of rate rises and while in most economies it appears to have peaked and is starting to fall, it is not falling fast enough for central banks’ liking as is evidenced by upside surprises in inflation. Moreover, core inflation (inflation less energy and food, whose prices are more cyclical and therefore less sensitive to rate rises) is not showing signs of falling and in the UK it is still rising. Headline CPI has fallen from 10.4% at the end of February to 8.7% at the end of May, whilst core CPI has risen from 6.2% to 7.4%.
This matters because core inflation is considered to be the most sensitive part, of the basket of goods and services in the inflation calculation, to interest rate changes. If, with all the rate increases we have had over the past eighteen months, core inflation is still not under control then the actions of central banks have either failed or they need to do even more, which is what the BOE did over the past quarter raising the base rate from 4.25% to 5.00% in two tranches. The last move from 4.5% to 5.0% was unexpected by the market but came from the unexpected upside inflation in May released the day before the June meeting of the Monetary Policy Committee.
Unintended Consequences
Unexpected inflation has unintended consequences. Here it comes in the form of rising interest rates, rising for longer and higher than expected. In the UK at the end of Q1 the expectation of the market was for rates to peak in September of 2023 at 4.58%, so somewhere between 4.5% and 4.75% for the base rate. We are clearly through that now with the base rate at 5%. At the end of June, the market had revised its expectations which are now for rates to peak in February 2024 at somewhere between 6.0% and 6.25%, but closer to 6.25%. So, where we had been in an environment of nearing peak interest rates, the situation has shifted and we are once again further away from the end of the rate rising cycle and can expect more rises to come.
There is growing evidence that the rate rises from last year are starting to have an impact on economic activity. The rate rises from the first half of 2022 are only now starting to be felt in the economy and markets. The rate rises from the second half of 2022, which were higher than the first half will not have their full effect felt till the second half of 2023. It is this lag-effect that worries us. Economic activity is at best anaemic globally and both UK and Europe are worryingly close to recessionary conditions.
In the UK Q1 GDP growth came in at 0.1% and growth for the previous year was just 0.2%. Many economic indicators are weak, whether it be retail sales, industrial and manufacturing production, consumer sentiment or purchasing managers’ indices. The one indicator that is holding up and probably keeping us from falling into a deep recession is employment which remains robust. The UK unemployment rate has barely moved this year with the rate hovering around 3.8%. Moreover, not only are people still in work but they are earning more, with UK wage inflation running at 7.2%. This is still below the headline rate of inflation, and close to core inflation, so it is a real terms pay cut, but it is small which is what is probably saving the UK economy from being in recession. It is however also a contributor to inflation itself and so the BOE is wary of wage-push inflation becoming endemic in the system.
Stronger in the US
Growth in the US is more robust, but still below long-term trends. The Fed too is still in a rate rising mood as, while inflation is falling and falling quicker than it is the UK, core inflation is high and above headline inflation. Rates in the US increased from 5.0% to 5.25% over the quarter, and while the Fed paused in June, they indicated that rates would continue to rise throughout the year while inflation remained a threat. As with the UK employment remains robust in the US and workers are experiencing wage increases, although at a lower rate than the UK.
It is a similar story in the EU with growth low, inflation high, but falling, and the European Central Bank (ECB) raising rates. The ECB made two upward revisions to the main refinancing rate during the quarter, raising rates from 3.5% to 4.0% and offered guidance that there would be more to come.
We are not yet at peak interest rates and inflation is proving more difficult to reduce back to target than first anticipated, and this is being experienced in almost every developed economy. Growth is anaemic at best, but thus far the spectre of recession has been kept at bay. Central Banks and governments the world over will be looking to how the economy performs over the rest of the year and there is a strong probability that we still could enter a recession, but it may be shallower than expected if employment remains strong and there is some wage growth.
Market Performance
Bond markets suffered significant falls during the quarter as rate expectations rose and expected cuts in interest rates were pushed out to 2024. In the UK the ten-year Gilt yield rose from 3.49% at the end of Q1 to 4.39% by the end of Q2, nearly a full 1% of yield expansion. At the short end the two-year Gilt yield rose from 3.44% to 5.27%, nearly 2% of tightening. The yield curve having been essentially flat at the end of Q1 suffered a significant inversion during the quarter. This inversion is normally a good signal of an impending recession, but equity markets have seemed to have ignored the signal so far.
With rising yields so came losses yet again in the bond markets and Gilts, with their longer duration, suffered in particular. Gilts overall lost 6.0%, with longer dated Gilts underperforming shorter dated ones. Short dated 1–5-year Gilts lost 3.0% over the quarter while long-dated 10 year plus Gilts lost 8.0%. Index linked Gilts underperformed nominal Gilts losing 6.9% over the quarter, although given the long duration nature of index linked Gilts this was a good result. Gilts in the 1–10-year range lost 4.1% while index linked Gilts in the same maturity band lost just 2.3%. Finally, there was a benefit from holding inflation-linked Gilts, which was sorely lacking last year in the face of high inflation.
Sterling investment grade credit outperformed gilts significantly over the quarter losing 3.4%. This outperformance was driven more by duration than it was by credit tightening. Short dated sterling corporate bonds lost 2.1%, less than short dated gilts which were down 3.0%. the small amount of spread tightening bought current spreads close to their long-term median. If the inversion of the Gilt yield curve was indicating recession, no one told the credit market with tightening credit spreads and falling probability of defaults.
It was a mixed picture for equities over the quarter. While the MSCI World gained 3.9% in sterling terms it was concentrated in certain sectors and regions. In the US and Japan equity markets gained 8.6% and 15.7% in local terms. Very good returns indeed. However, these returns were driven by expanding valuations rather than higher earnings. Earnings in the US and Japan were essentially flat or slightly higher. In the US the return almost came from 100% multiple expansion while in Japan it accounted for 80% of the return.
The UK and Europe lagged far behind losing 0.6% and gaining 0.9% respectively. Here also earnings were flat, the difference between these two regions and the US and Japan was that there was either no multiple expansion in the case of Europe or a small multiple contraction in the case of the UK.
Growth stocks led the global rally gaining just under 7.4% while value stocks gained just 0.2%. Large cap stocks significantly outperformed small caps stocks gaining 4.5% against gains of just 0.4% for small cap stocks. There were significant sectorial differences over the quarter. The best performing sector over the quarter was Information Technology which gained 11.5%, with the next best performing sector consumer discretionary gaining 7.5%. Otherwise returns were weak in other sectors with energy, utilities, consumer staples and materials all losing between 2% and 3%.
Equity market performance therefore was driven by US large cap growth stocks, almost entirely due to a change in market sentiment rather than an increase in the underlying earning fundamentals. We can see this in some of the largest S&P 500 stocks. Apple gained 17.6%, Microsoft 18.1%, Amazon 26.2%, Alphabet 16.3%, Meta 35.4%, Tesla 26.2% and NVIDIA 52.3%. In some cases there was an earnings surprise on the upside that drove prices up, but more often than not there wasn’t. It remains to be seen if these elevated valuations are met by Q2 earnings upgrades. If not, we may be due a claw back in prices.
Finally, Sterling strengthened against most major currencies over the quarter gaining 3% against the Dollar, 2.03% against the Euro and 11.8% against the Yen, which suffered significant falls against all major currencies, muting domestic equity market returns for foreign investors.
Portfolio performance
Your portfolios generated a mix of positive and negative returns over the quarter, with higher risk portfolios outperforming lower risk portfolios. The table below shows returns for Active, Passive and Sustainable portfolios, alongside the returns of their respective inflation benchmarks and for comparison purposes their appropriate IA sector over the quarter.
| 3 Months to 30 June 2023 | Active | Passive | Sustainable | Inflation Benchmark | IA Sector |
| Defensive | -0.58% | -0.83% | -0.63% | 1.09% | |
| Cautious | -0.46% | -0.47% | -0.16% | 2.66% | -0.95% |
| Balanced | 0.10% | 0.25% | 0.55% | 2.89% | -0.38% |
| Growth | 0.65% | 0.98% | 1.47% | 3.12% | 0.17% |
| Adventurous | 1.29% | 1.84% | 2.34% | 3.34% |
Source: Morningstar
Portfolios with higher weights to fixed income suffered losses while as we moved up the risk spectrum those portfolios with higher equity weights benefited from rising markets and provided positive returns. Our non-equity assets lost 1.3% over the quarter while our active equity funds gained 1.5%, underperforming our passive equity funds which gained 2.0%. Overall our portfolios outperformed their Relative IA sectors, whether they be active, passive or sustainable.
The chart below shows the returns of funds within the portfolios for the quarter.
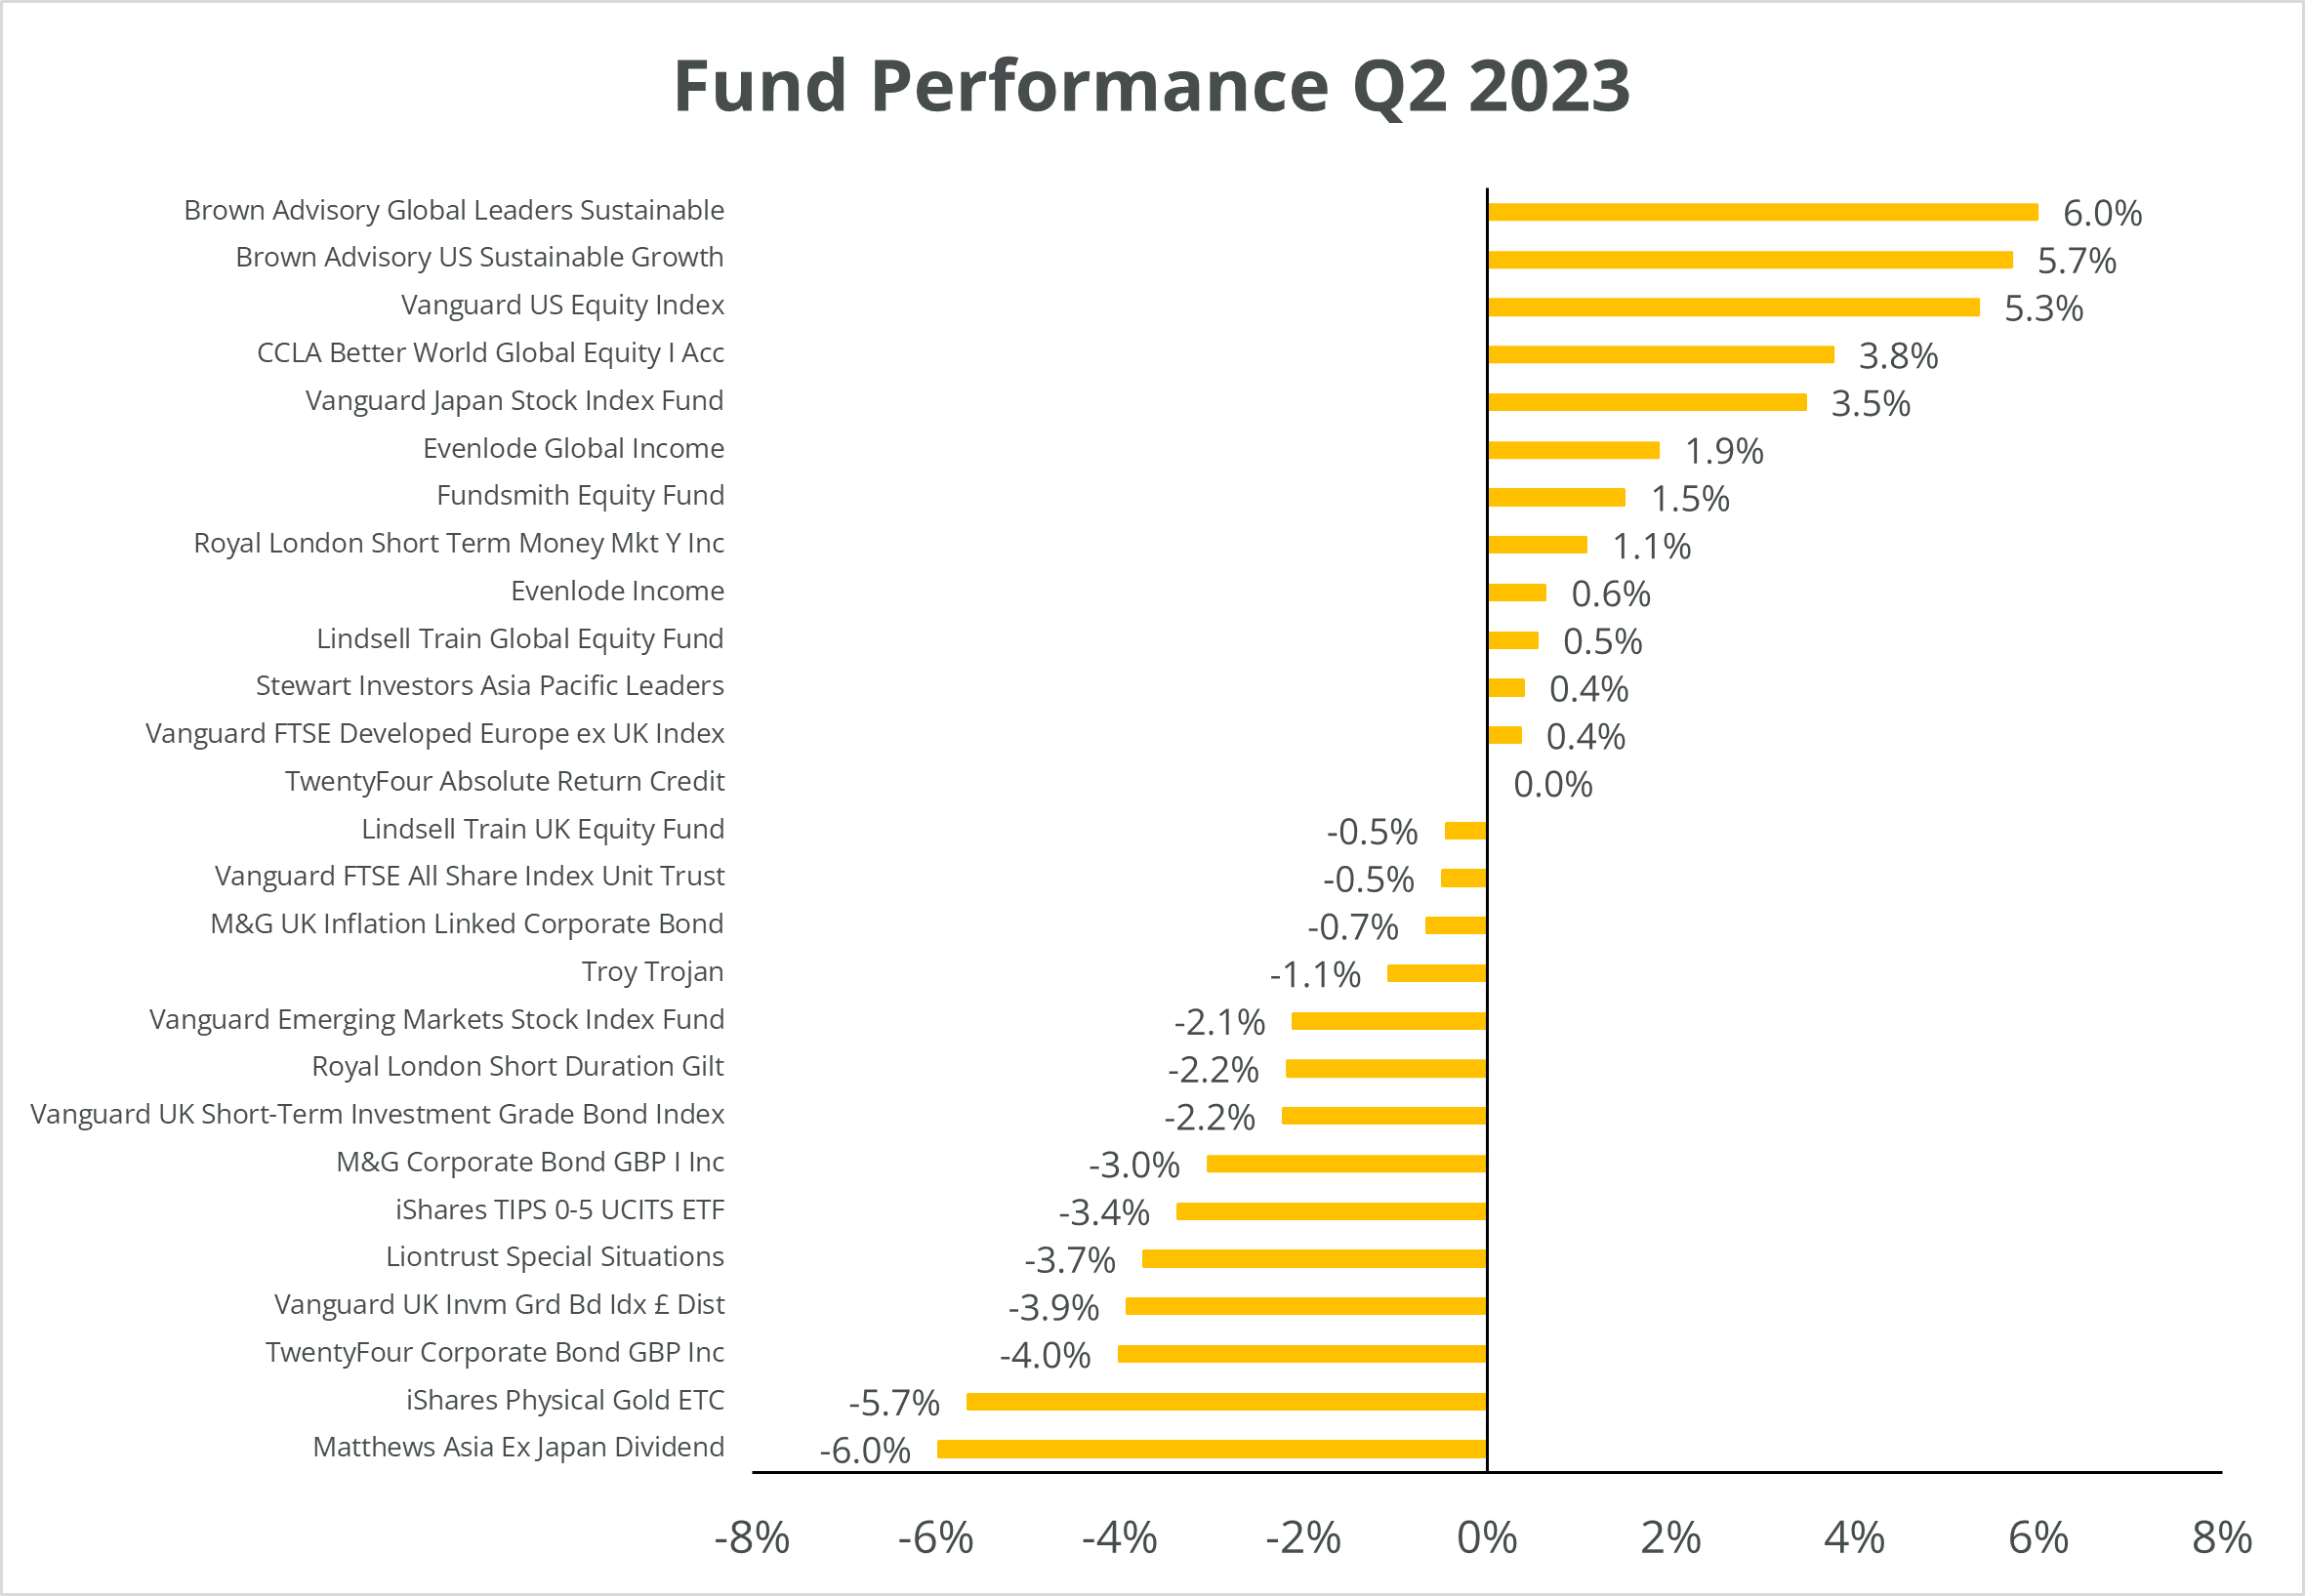
Source: Morningstar
All of our bond funds, both active and passive, posted negative returns over the quarter. The one exception was TwentyFour Absolute Return Credit fund which was flat. M&G UK Inflation Linked Corporate Bond fund was the next best active performer falling 0.7% over the quarter, ahead of the passive Vanguard UK Short-Term Investment Grade Bond Index which was down 2.2%. Our short-dated Gilt tracker also lost 2.2% while wider Gilts lost 6.0%. Overall, our bond funds lost 1.4% over the quarter.
Our active equity funds were mostly up and those with higher US and technology exposure performed the best. The best performer was Brown Advisory Global Sustainable leaders which gained over 6% over the quarter, followed by Brown US Sustainable Growth which gained 5.7%. Our other global equity funds provided decent positive returns but with most underperforming the MSCI World as and overweight to consumer staples weighed on returns.
We remain committed to our equity growth bias within portfolios, not least because the majority of our funds have continued to report that their underlying holdings have on average grown their earnings over the year. Not a feature that we have seen in the market as a whole. We invest for the long-term growth in earnings rather than try to trade the valuation cycle.
Portfolio outlook
We made significant changes to the portfolios over the quarter. These changes are summarised below and were implemented at the end of April 2023.
One Four Nine Active Portfolios
Asset Allocation Changes
- No significant changes to weights of Cash, Fixed Income and Equity at the super asset class level.
- Reduced Gilt exposure in favour of increased investment grade credit.
- Within Investment Grade Credit extending bond duration from 2 years to 4 years.
- For the Defensive model a reduction in equity reweighted into cash and fixed income to bring the risk of the portfolio into line with its target risk.
Fund Changes
- The movement of cash into the Royal London Short-term Money Market fund to take advantage of better yields, maintaining the minimum of 2% cash on the platform.
- Purchase of the M&G Corporate Bond fund and the TwentyFour Corporate Bond fund and reweighting existing short duration funds to achieve an increase in the bond duration from 2 years to 4 years.
- Purchase of the CCLA Better World Global Equity fund within global equities.
- Full Sale of the Blue Whale Growth Fund within Global Equities.
One Four Nine Passive Portfolios
Asset Allocation Changes
- Asset allocations are driven by changes in the asset allocations of the look-through asset allocation of the Active portfolios. As such there has been small changes to the weights of cash, fixed income and equity weights within the passive portfolios.
- At an overall asset allocation level, there has been a small reduction in cash, UK and US equity, and gold in favour of fixed income, due to new look through asset allocations from active models.
- Reduced Gilt exposure in favour of increased investment grade credit.
- Within Investment Grade Credit extending bond duration from 2 years to 4 years.
- For the Defensive model a reduction in equity reweighted into cash and fixed income to bring the risk of the portfolio into line with its target risk.
Fund Changes
- The movement of cash into the Royal London Short-term Money Market fund to take advantage of better yields, maintaining the minimum of 2% cash on the platform.
- Purchase of the Vanguard UK IG Bond Index and reweighting Vanguard UK Short Dated IG Bond Index to achieve an increase in the bond duration from 2 years to 4 years.
One Four Nine Sustainable Portfolios
Asset Allocation Changes
- Some minor asset allocation changes to bring the risk of sustainable portfolios into line with the risk of the active portfolios.
- At an overall asset allocation level, we have made a small reduction in equity and a small increase in fixed income, however none of these changes are more than 3%. Some of these changes have also been driven by the introduction of new funds into the portfolios, in particular a reduction to the weight to US equities and an increase in the weight to UK equities.
- Reduced Gilt exposure in favour of increased investment grade credit.
- Within Investment Grade Credit some small reweighting of existing funds to increase bond duration to 4 years.
- For the Defensive model a reduction in equity reweighted into cash and fixed income to bring the risk of the portfolio into line with its target risk.
Fund Changes
- The movement of cash into the Royal London Short-term Money Market fund to take advantage of better yields, maintaining the minimum of 2% cash on the platform.
- Purchase of the Evenlode Income fund within UK Equities.
- Purchase of the CCLA Better World Global Equity fund within global equities.
- Purchase of the Troy Trojan Ethical fund to mirror the allocation to the Troy Trojan fund within the active portfolios.
- Full sale of the Liontrust Sustainable Future UK Growth Fund.
Overall, our long-term outlook remains unchanged, but there are now some medium-term opportunities in bonds which we have looked to take. Expected returns for all asset classes look much better than they did a year ago and there is some room to add risk in portfolios, mindful that if the recessionary conditions worsen that there will be short-term pain. The balance of probabilities is for better long-term performance from portfolios.
Find out how One Four Nine Portfolio Management invest here.
Dr Bevan Blair,
Chief Investment Officer,
One Four Nine Portfolio Management
London, Thursday 10 August 2023.
All investment views are presented for information only and are not a personal recommendation to buy or sell. Past performance is not a reliable indicator of future returns, investing involves risk and the value of investments, and the income from them, may fall as well as rise and are not guaranteed. Investors may not get back the original amount invested.
All data is at 30 June 2023. One Four Nine Models are benchmarked against UK CPI and any other benchmark has been displayed for comparative purposes only and is not a benchmark for the Models. Performance figures are net of underlying fund fees and include One Four Nine Portfolio Management’s Management Fee of 0.24% (including VAT). All model portfolio performance data is sourced from One Four Nine Portfolio Management. All other data is from Bloomberg and Morningstar.
This service is intended for use by investment professionals only. This document does not constitute personal advice. If you are in doubt as to the suitability of an investment, please contact your adviser.
One Four Nine Group Limited Registered in England No: 11866793. One Four Nine Portfolio Management Limited is registered in England No: 11871594 and is authorised and regulated by the Financial Conduct Authority (FCA) FRN: 931954. One Four Nine® is a registered trademark.